

A Cognitive Approach to Health Tracking
Vital is a menstrual cycle and health tracking app designed to reduce cognitive load and prevent "tracking fatigue." This case study explores the end-to-end product design process from information architecture to high-fidelity UI, focusing on transforming complex biological data into clear, actionable insights.
UX Research & Design by Dalia Grosz.
Project background
Vital was born from the understanding that health tracking is more than just data entry; it's about Self-Efficacy. Users often feel overwhelmed by their own biological data. The goal was to create a tool that helps users build a clear Mental Model of their health, transforming raw symptoms into actionable insights without increasing cognitive fatigue.
UI Design
InVision


1. Positive Feedback Loops: I hypothesized that by providing immediate, visual rewards for logging data, we could encourage long-term Habit Formation.
2. Mental Mapping: I assumed that aligning the app's Information Architecture with the user's existing Mental Models of time and cycle would significantly reduce the 'Learning Curve' and increase user retention.
1. Research
I compared two leading menstrual cycle-tracking apps — Clue and Flo — focusing on how they build trust, communicate authority, and handle user data. I then identified key UX patterns to inform my own design decisions.
Full cycle tracking — period, menstruation, pregnancy. Builds trust through a data-ethics-first stance.
Consistently rated among the top tracking apps. Free tier available. Strong data-privacy positioning for privacy-conscious users.
Full cycle tracking. Recommended by OB-GYNs. Strong motivational hooks to drive app adoption.
Global reach, wide social-media presence. Ovulation chat assistant. Premium membership model.
Relies on the Authority Heuristic ("Recommended by OB-GYNs") and aggressive push notifications. Drives short-term engagement but limited data transparency can create privacy anxiety.
Prioritises data ethics and security, creating a safe space for sharing sensitive health data. Critical for long-term retention and accurate tracking.
- Data privacy leadership (Clue)
- OB-GYN endorsements (Flo)
- High market visibility
- Comprehensive tracking features
- Flo shares sensitive data with advertisers
- High cognitive load in both UIs
- Flo's free tier is heavily restricted
- Reduce tracking friction & fatigue
- Clearer data transparency messaging
- Accessible design for unwell users
- Privacy regulation changes
- User distrust post data-sharing scandals
- Growing market competition

Logical flow with a persistent tab bar for easy access across most screens.

Supports iPhone, iPad and Android. Mobile-only — no desktop version.

Positioned as a leading inclusive tracking app with a feminist, data-ethics-first identity — a strong trust signal for privacy-conscious users. Content is peer-reviewed.
However, the data analysis section lacks actionable conclusions; users may lose motivation if they can't see what to do with their data. A search feature in the articles section would also improve discoverability. Competitors leveraging AI for symptom tracking pose a growing threat.

Sign-in is required to unlock predictions. Without an account, the app is limited to educational content only. Users can download and share their data with partners.
To revisit the problem and test my hypotheses, I conducted interviews with five participants — all people who menstruate — to understand their real-world tracking behaviours and pain points.
The interviews were structured around five key learning objectives:
All five participants said they track primarily for three reasons: to avoid or plan a pregnancy, to predict the start of their period so they can adapt their schedule, and to better understand their own bodies.
None of the participants actively tracked mental symptoms. Most found the idea interesting in theory, but did not see practical benefit in adapting their daily lives based on mood or emotional data.
Participants responded more readily to physical symptoms — pain, fatigue, flow — than to psychological or emotional cues.
Writing down dates was the most common method across participants. Only one participant used a more advanced approach — tracking basal body temperature and cervical fluids — without recording actual calendar dates.
All five participants were familiar with cycle-tracking apps, though only two used one as their primary method. The interviews confirmed the core design challenge: users want quick, low-effort logging that gives them reliable predictions — not a data-heavy dashboard.
2. Empathize
Defining Behavioral Archetypes & Information Hierarchy
Following the research phase, I translated my insights into Behavioral Archetypes (Personas). The goal was to move beyond simple demographics and understand the Mental Models and emotional states of users interacting with their health data. This phase was crucial for establishing a logical Information Architecture that aligns with user expectations and minimizes cognitive friction.
User Personas & User Journeys
Throughout the interview stage, I gathered information about potential users of the product. I defined their needs, goals, and motivations as users of the app to guide the research and design process.
When important decisions had to be handled, I used these imaginary personas as a guide that would help me find the right answer.
For this matter, I created two personas, although I believe that there are more than two potential group targets. Due to time restrictions, I kept the scope to two personas.
User Personas
Ella is an illustrator living in California, in a relationship with a queer male. They like using technology but have long neglected their body. After going through an identity crisis and becoming queer, the menstrual cycle remains an emotionally charged subject — triggering Avoidance Behaviour rooted in Identity–Body Incongruence.
- Stay aware of their menstrual cycle to prevent pregnancy
- Get to know their body without emotional overwhelm
- Track their cycle with minimal time and friction
- Preventing unwanted pregnancy
- Understanding their body as a queer person
- Replacing home-made tables and books with a reliable digital tool
Ella's primary barrier is Avoidance Behaviour: interacting with menstrual data creates anxiety due to past neglect and identity crisis. The UX goal is Empathetic Minimalism — reducing gendered visual language and minimising data-entry steps to lower the emotional threshold.
Emilia is a communications student navigating newfound independence. Her primary psychological driver is the transition from external reliance on family to Self-Efficacy over her own reproductive health. She is highly motivated to learn but faces an information gap — leading to anxiety around unpredictability.
- Establish a strong sense of Bodily Autonomy and control
- Bridge her knowledge gap on cycle fluids and ovulation through accessible micro-learning
- Reliably prevent pregnancy through accurate tracking
Emilia seeks a digital tool that acts as a guide — providing structured education and fostering responsible habits without feeling overly clinical or medical.
Experiencing high Cognitive Friction when trying to piece together health information independently — realising the lack of foundational knowledge she received growing up.
Mental Models & User Journey | Mapping Emotional & Cognitive States
The User Journey isn't just a sequence of actions; it's a map of the user's emotional fluctuation. I identified critical Friction Points where users typically lose motivation or feel confused by data complexity. My design intervention focused on these specific moments to provide Cognitive Ease and supportive feedback.
Mental Models
Ella seeks to manage their reproductive health and gain bodily awareness, but feels a strong psychological distance from the process. They require a neutral, inclusive environment to log cycle data. The goal is to seamlessly track ovulation and menstruation while acquiring personalised health knowledge, without encountering gender-biased terminology or cognitive friction.
- Open app and set up an account
- Log in period date information
- Log in symptom data according to the date
- Enter the app
- Read cycle day and symptoms
- Find out what certain symptoms mean
- Learn how to treat symptoms
- Enter the app
- Go to data analysis
- Find the predicted ovulation date
- Find the predicted period date
"To begin with, one needs to detect their cycle day. I believe this is the first step in starting to learn your body."
"Since I stopped using the anti-contraceptive pill, I learned that there is much about my body that I didn't know. Now I'm starting to experience myself in a new way and I want to do it right."
"When I will be able to predict my period and ovulation I will feel much safer having sex and understanding how the symptoms are connected."
- Add dates of the period
- Progressive Disclosure for symptom logging to avoid overwhelming the user
- Use neutral, non-gendered UI elements to build Psychological Safety
- Customisable Dashboards — toggle between Medical, Emotional, or Holistic data views
- Provide bite-sized, contextual education (Micro-learning) instead of long medical texts
- Automated Pattern Recognition — highlight correlations between cycle phases and emotional states
- Anticipatory Design — proactive notifications to prepare the user for predicted changes
- Open app and set up an account
- Log in period date information
- Log in symptom data according to the date
"To begin with, one needs to detect their cycle day. I believe this is the first step in starting to learn your body."
- Add dates of the period
- Progressive Disclosure for symptom logging
- Use neutral, non-gendered UI elements
- Enter the app
- Read cycle day and symptoms
- Find out what certain symptoms mean
- Learn how to treat symptoms
"Since I stopped using the anti-contraceptive pill, I learned that there is much about my body that I didn't know. Now I'm starting to experience myself in a new way and I want to do it right."
- Customisable Dashboards — Medical, Emotional, or Holistic views
- Provide bite-sized, contextual education (Micro-learning)
- Enter the app
- Go to data analysis
- Find the predicted ovulation date
- Find the predicted period date
"When I will be able to predict my period and ovulation I will feel much safer having sex and understanding how the symptoms are connected."
- Automated Pattern Recognition — highlight correlations
- Anticipatory Design — proactive notifications for predicted changes
Emilia wants to learn about her body and explore her sexuality. Since leaving her parents' home she feels that with the freedom she experiences she also needs to be more responsible towards herself. Her goal is to track her menstrual cycle and learn about her particular way of being and the female body from a spiritual, emotional, and medical perspective.
- Open app and set up an account
- Log in period date information
- Log in physical and emotional symptoms
- Log in Zodiac sign
- Log in birthday including time of birth
- Enter the app
- Explore and learn about different types of cycles
- Enter the app
- Go to data analysis
- Find predicted significant lunar changes that influence menstruation
"Tracking my period with the moon calendar fascinates me. I think the moon and my Zodiac sign are very significant when it comes to my menstruation."
"I was always interested in understanding how my character is influenced by my menstruation and vice-versa. And what does the moon have to do with it?"
"Part of being in control over my body means knowing how things outside can influence my inside and create my emotional state."
- Show the Lunar Calendar
- Show the Zodiac Calendar
- Allow choosing a particular calendar view
- Notifications about upcoming lunar phases
- Calling for meditation cycles
- Q&A section for self-guided learning
- Conclusion of the cycle date
- Analysis of symptoms
- Calendar showing patterns of symptoms
- Notifications about important predicted changes
- Open app and set up an account
- Log in period date information
- Log in physical and emotional symptoms
- Log in Zodiac sign
- Log in birthday including time of birth
"Tracking my period with the moon calendar fascinates me. I think the moon and my Zodiac sign are very significant when it comes to my menstruation."
- Show the Lunar Calendar
- Show the Zodiac Calendar
- Allow choosing a particular calendar view
- Enter the app
- Explore and learn about different types of cycles
"I was always interested in understanding how my character is influenced by my menstruation and vice-versa. And what does the moon have to do with it?"
- Notifications about upcoming lunar phases
- Calling for meditation cycles
- Q&A section for self-guided learning
- Enter the app
- Go to data analysis
- Find predicted significant lunar changes that influence menstruation
"Part of being in control over my body means knowing how things outside can influence my inside and create my emotional state."
- Conclusion of the cycle date
- Analysis of symptoms
- Calendar showing patterns of symptoms
- Notifications about important predicted changes
3. IDEATE
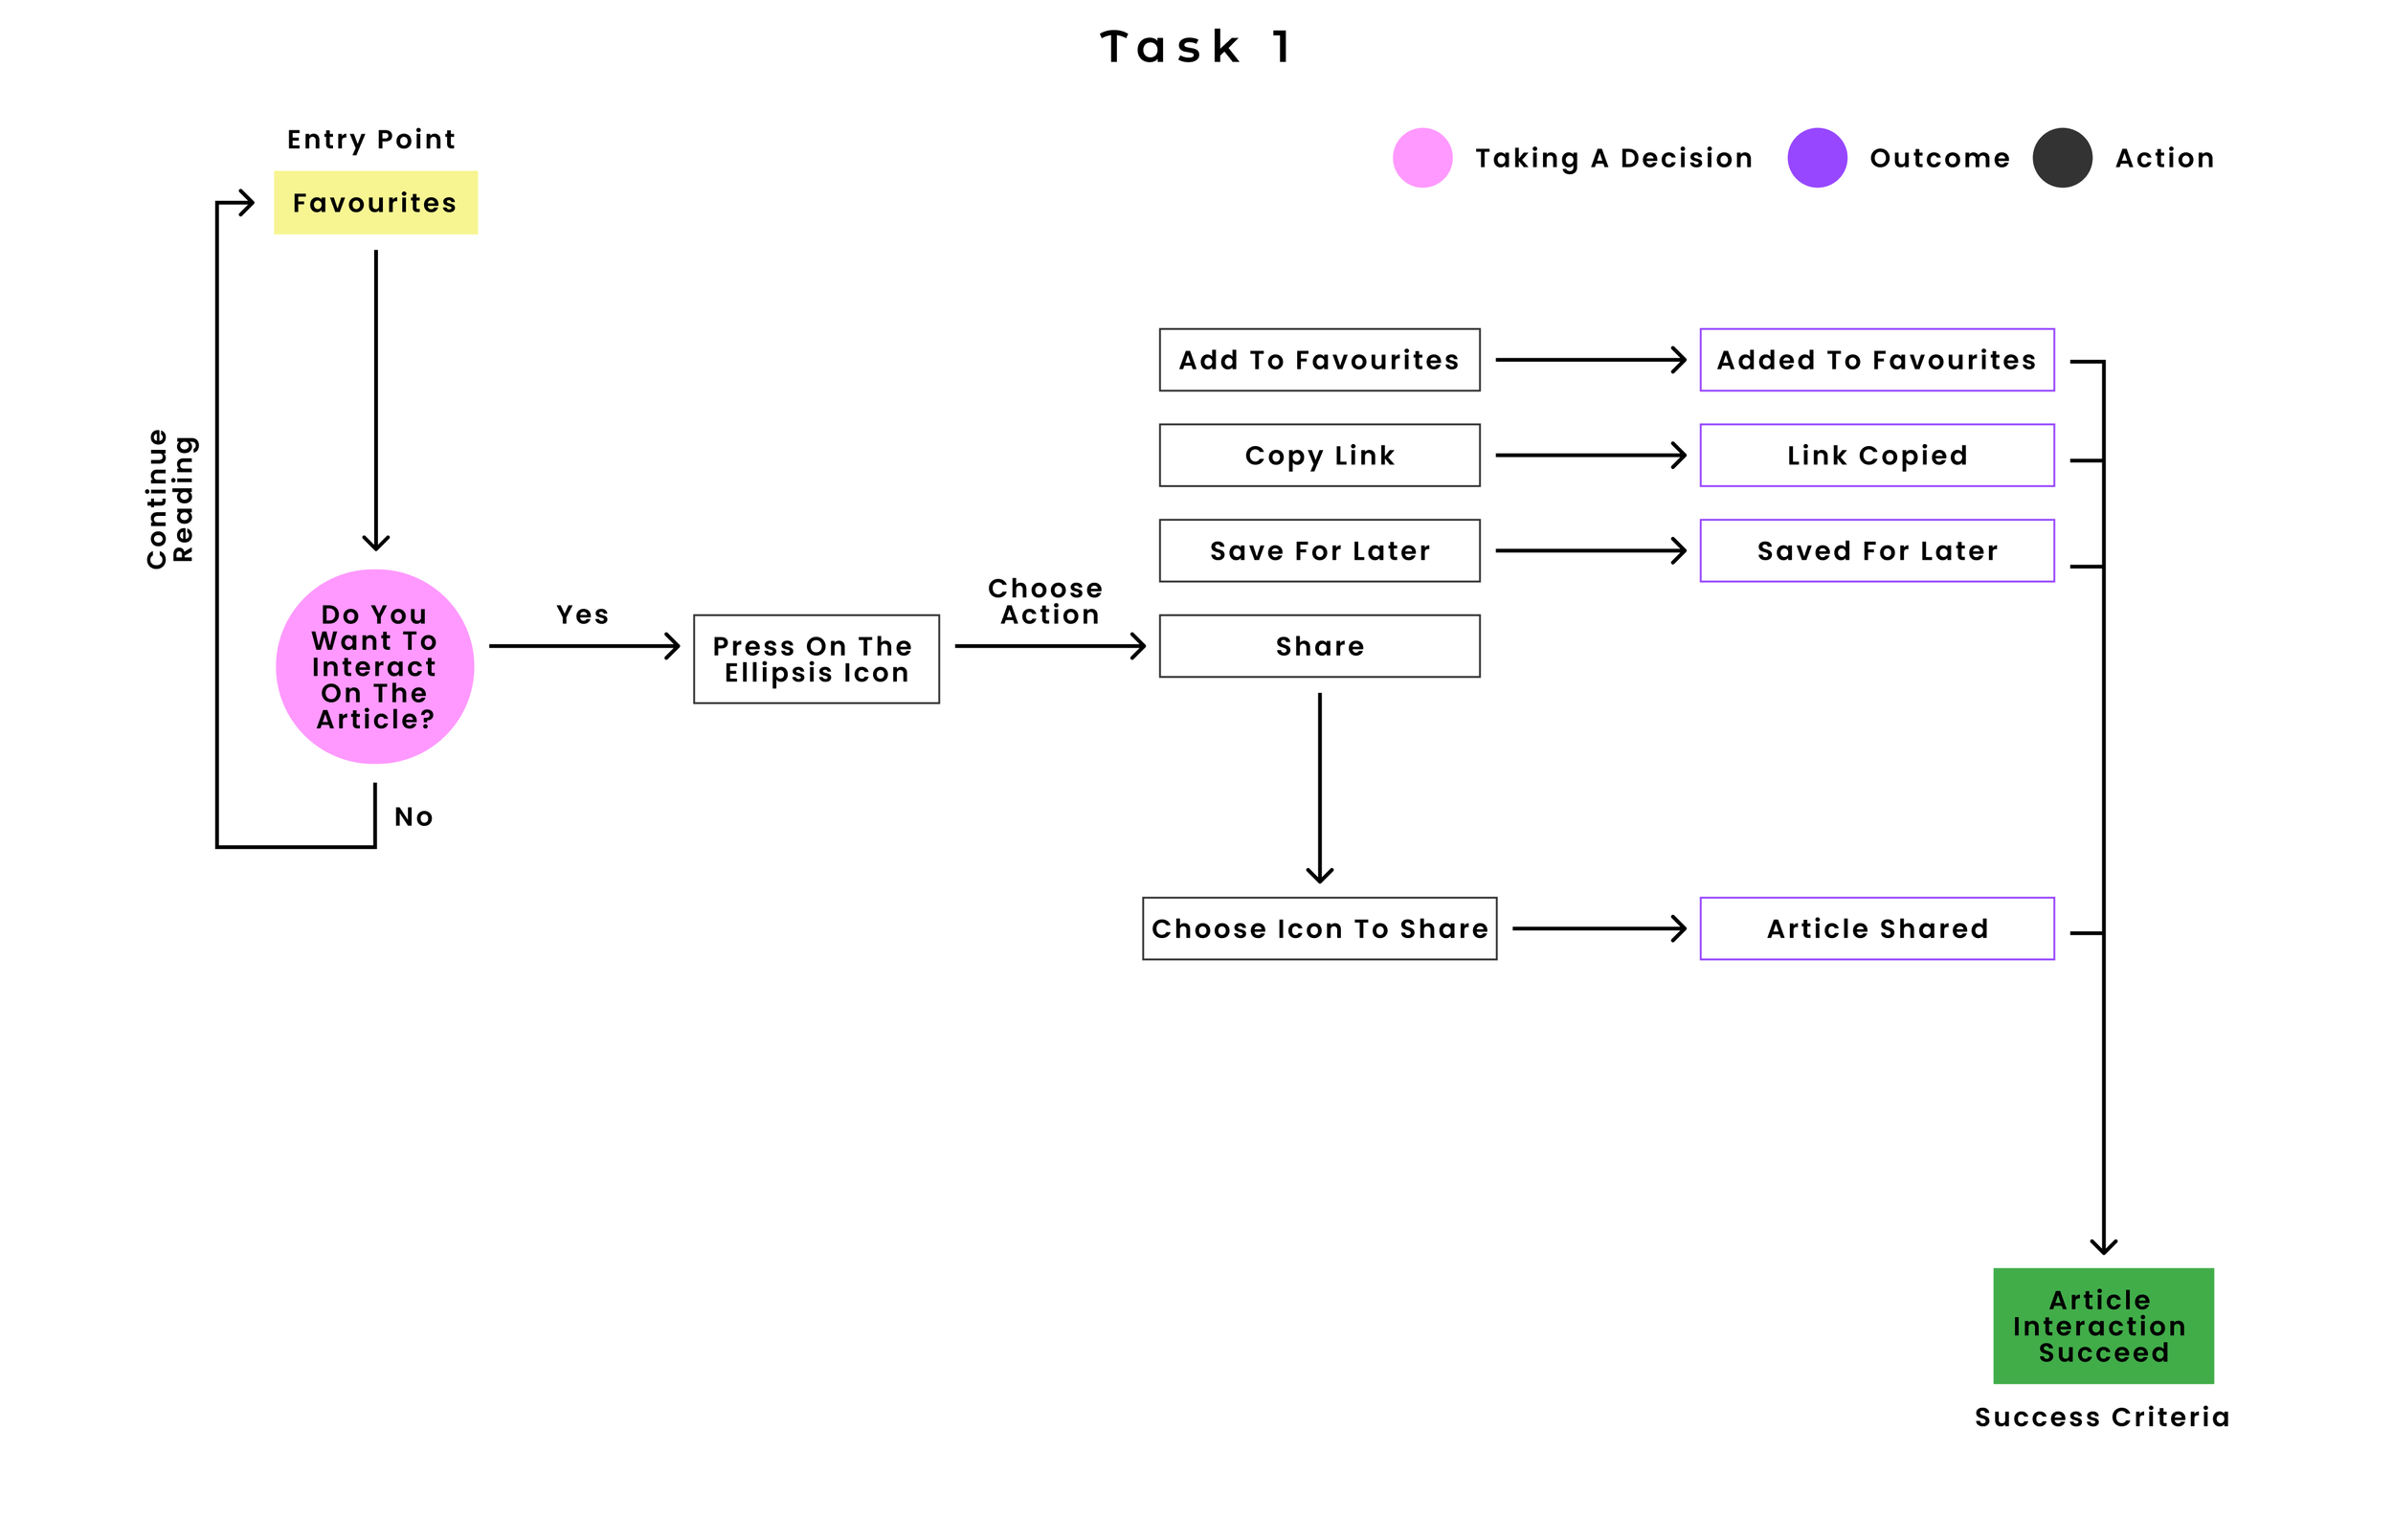
User Flows | Ideation & Logic Mapping
To ensure the interface actively reduces Cognitive Load, I mapped out the core User Flows before designing the UI. Each flow is optimized to minimize the number of clicks between the 'Entry Point' and the 'Success Criteria'. My primary goal was to create a frictionless environment, especially for tasks that require high daily motivation, like data entry. Below are the three core workflows I iterated on:
Flow 1: Educational Engagement (Discover)
Focusing on the user's need for 'Guided Discovery', this flow maps how users interact with content. The architecture allows users to execute quick actions (Save, Share, Favorite) without disrupting their reading experience, driving higher engagement and easy knowledge retrieval.
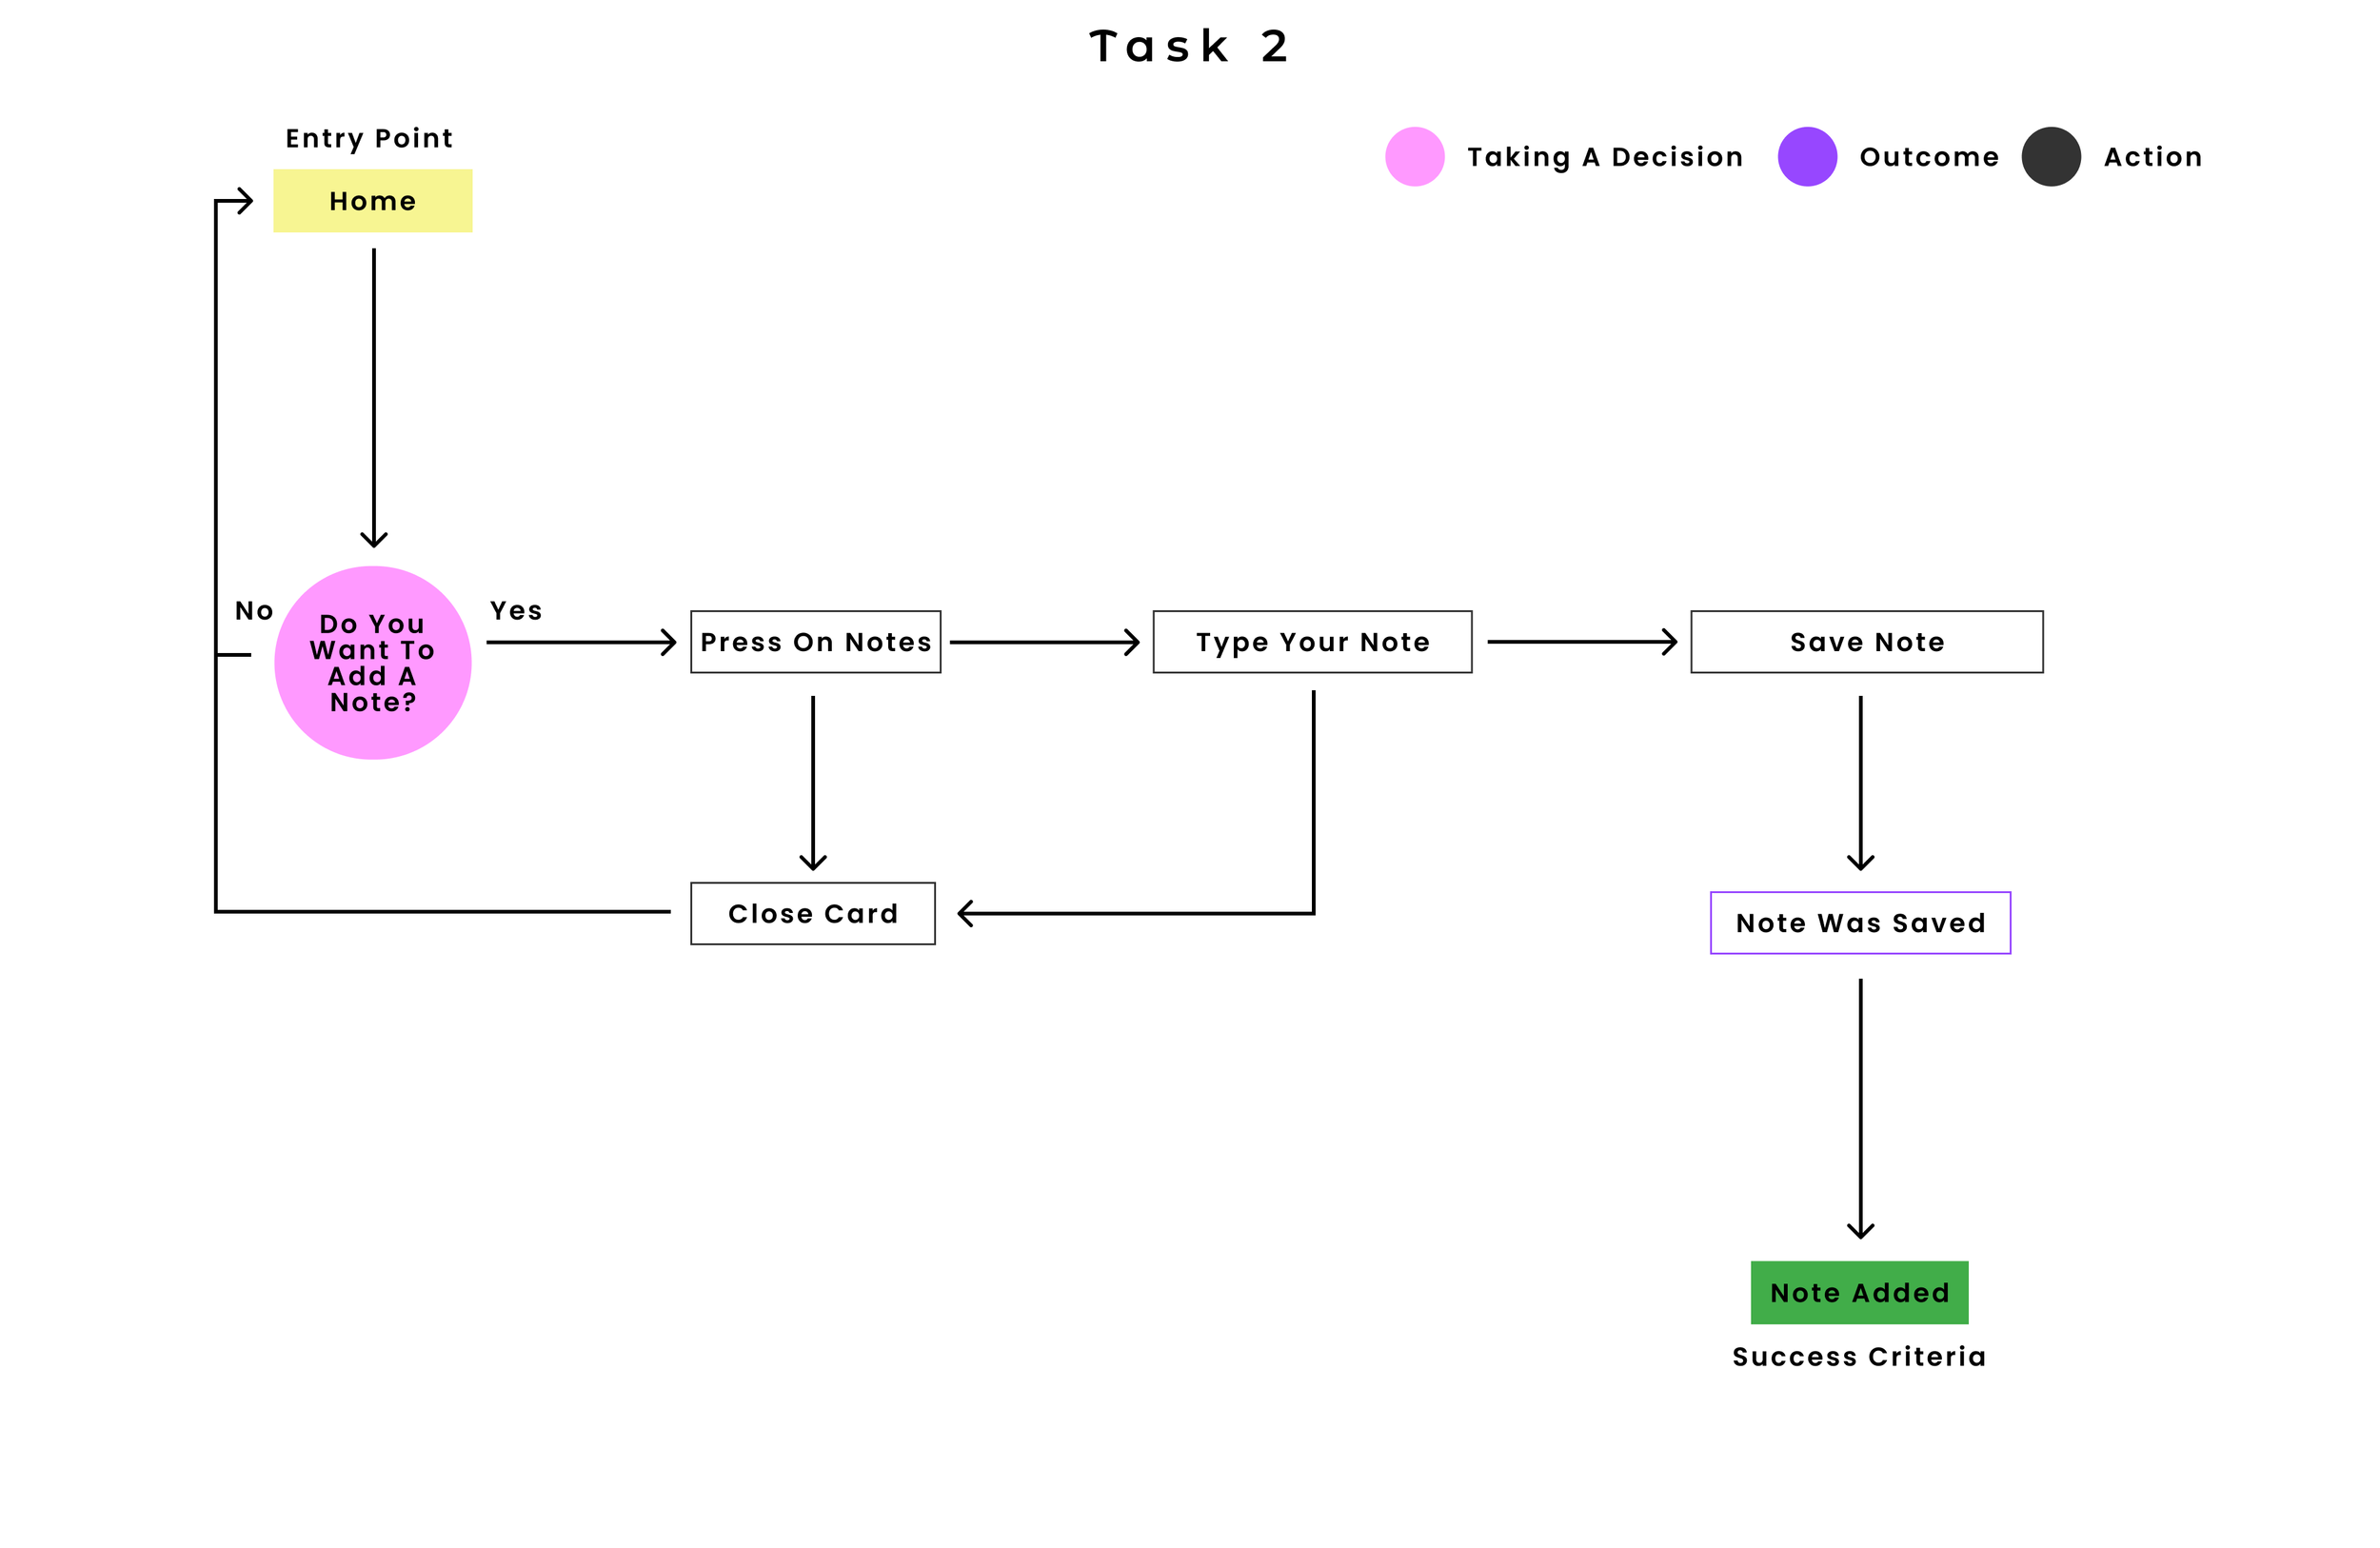
Flow 2: Contextual Journaling (Notes)
To support users who process their cycle emotionally, I designed a rapid journaling flow. By allowing users to quickly capture their thoughts with minimal interaction cost, the system accommodates varying levels of daily motivation.
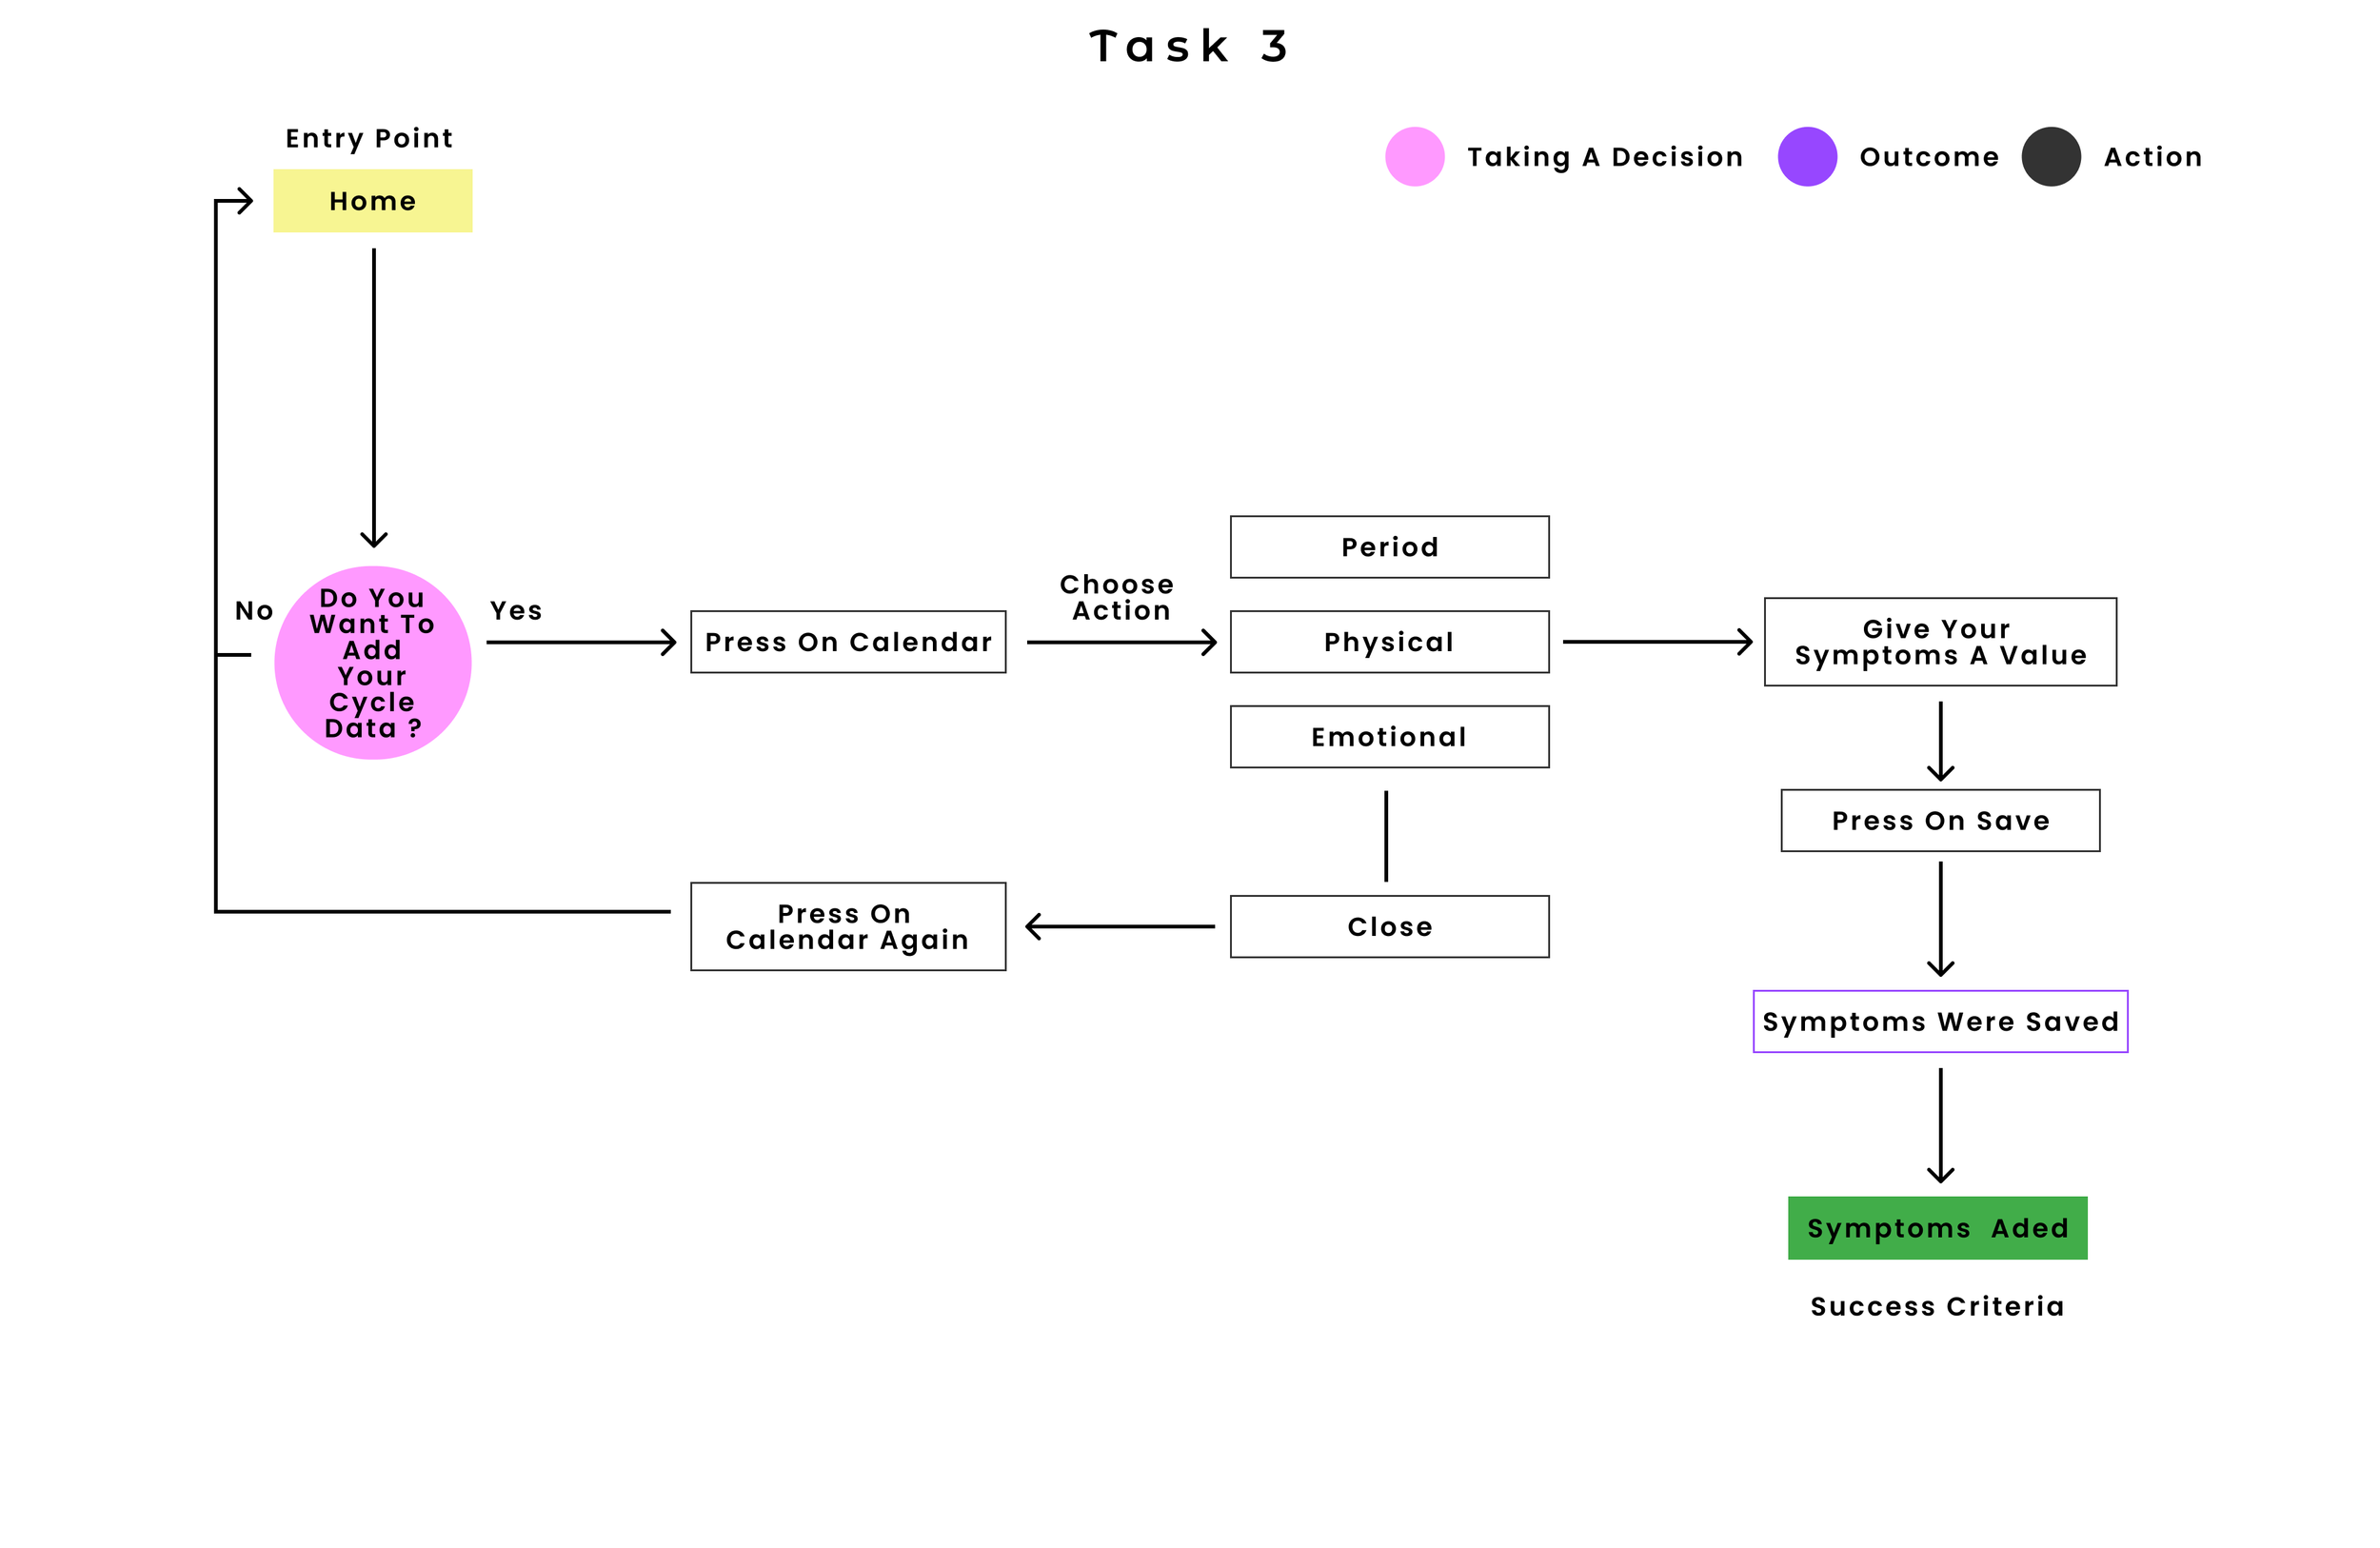
Flow 3: Frictionless Data Entry (Symptom Tracking)
Data input is typically the highest friction point in tracking applications. This flow breaks down the complex task of logging physical and emotional data into a linear, Progressive Disclosure process. By organizing inputs logically (Date -> Physical -> Emotional), we prevent 'Tracking Fatigue' and ensure accurate data collection.
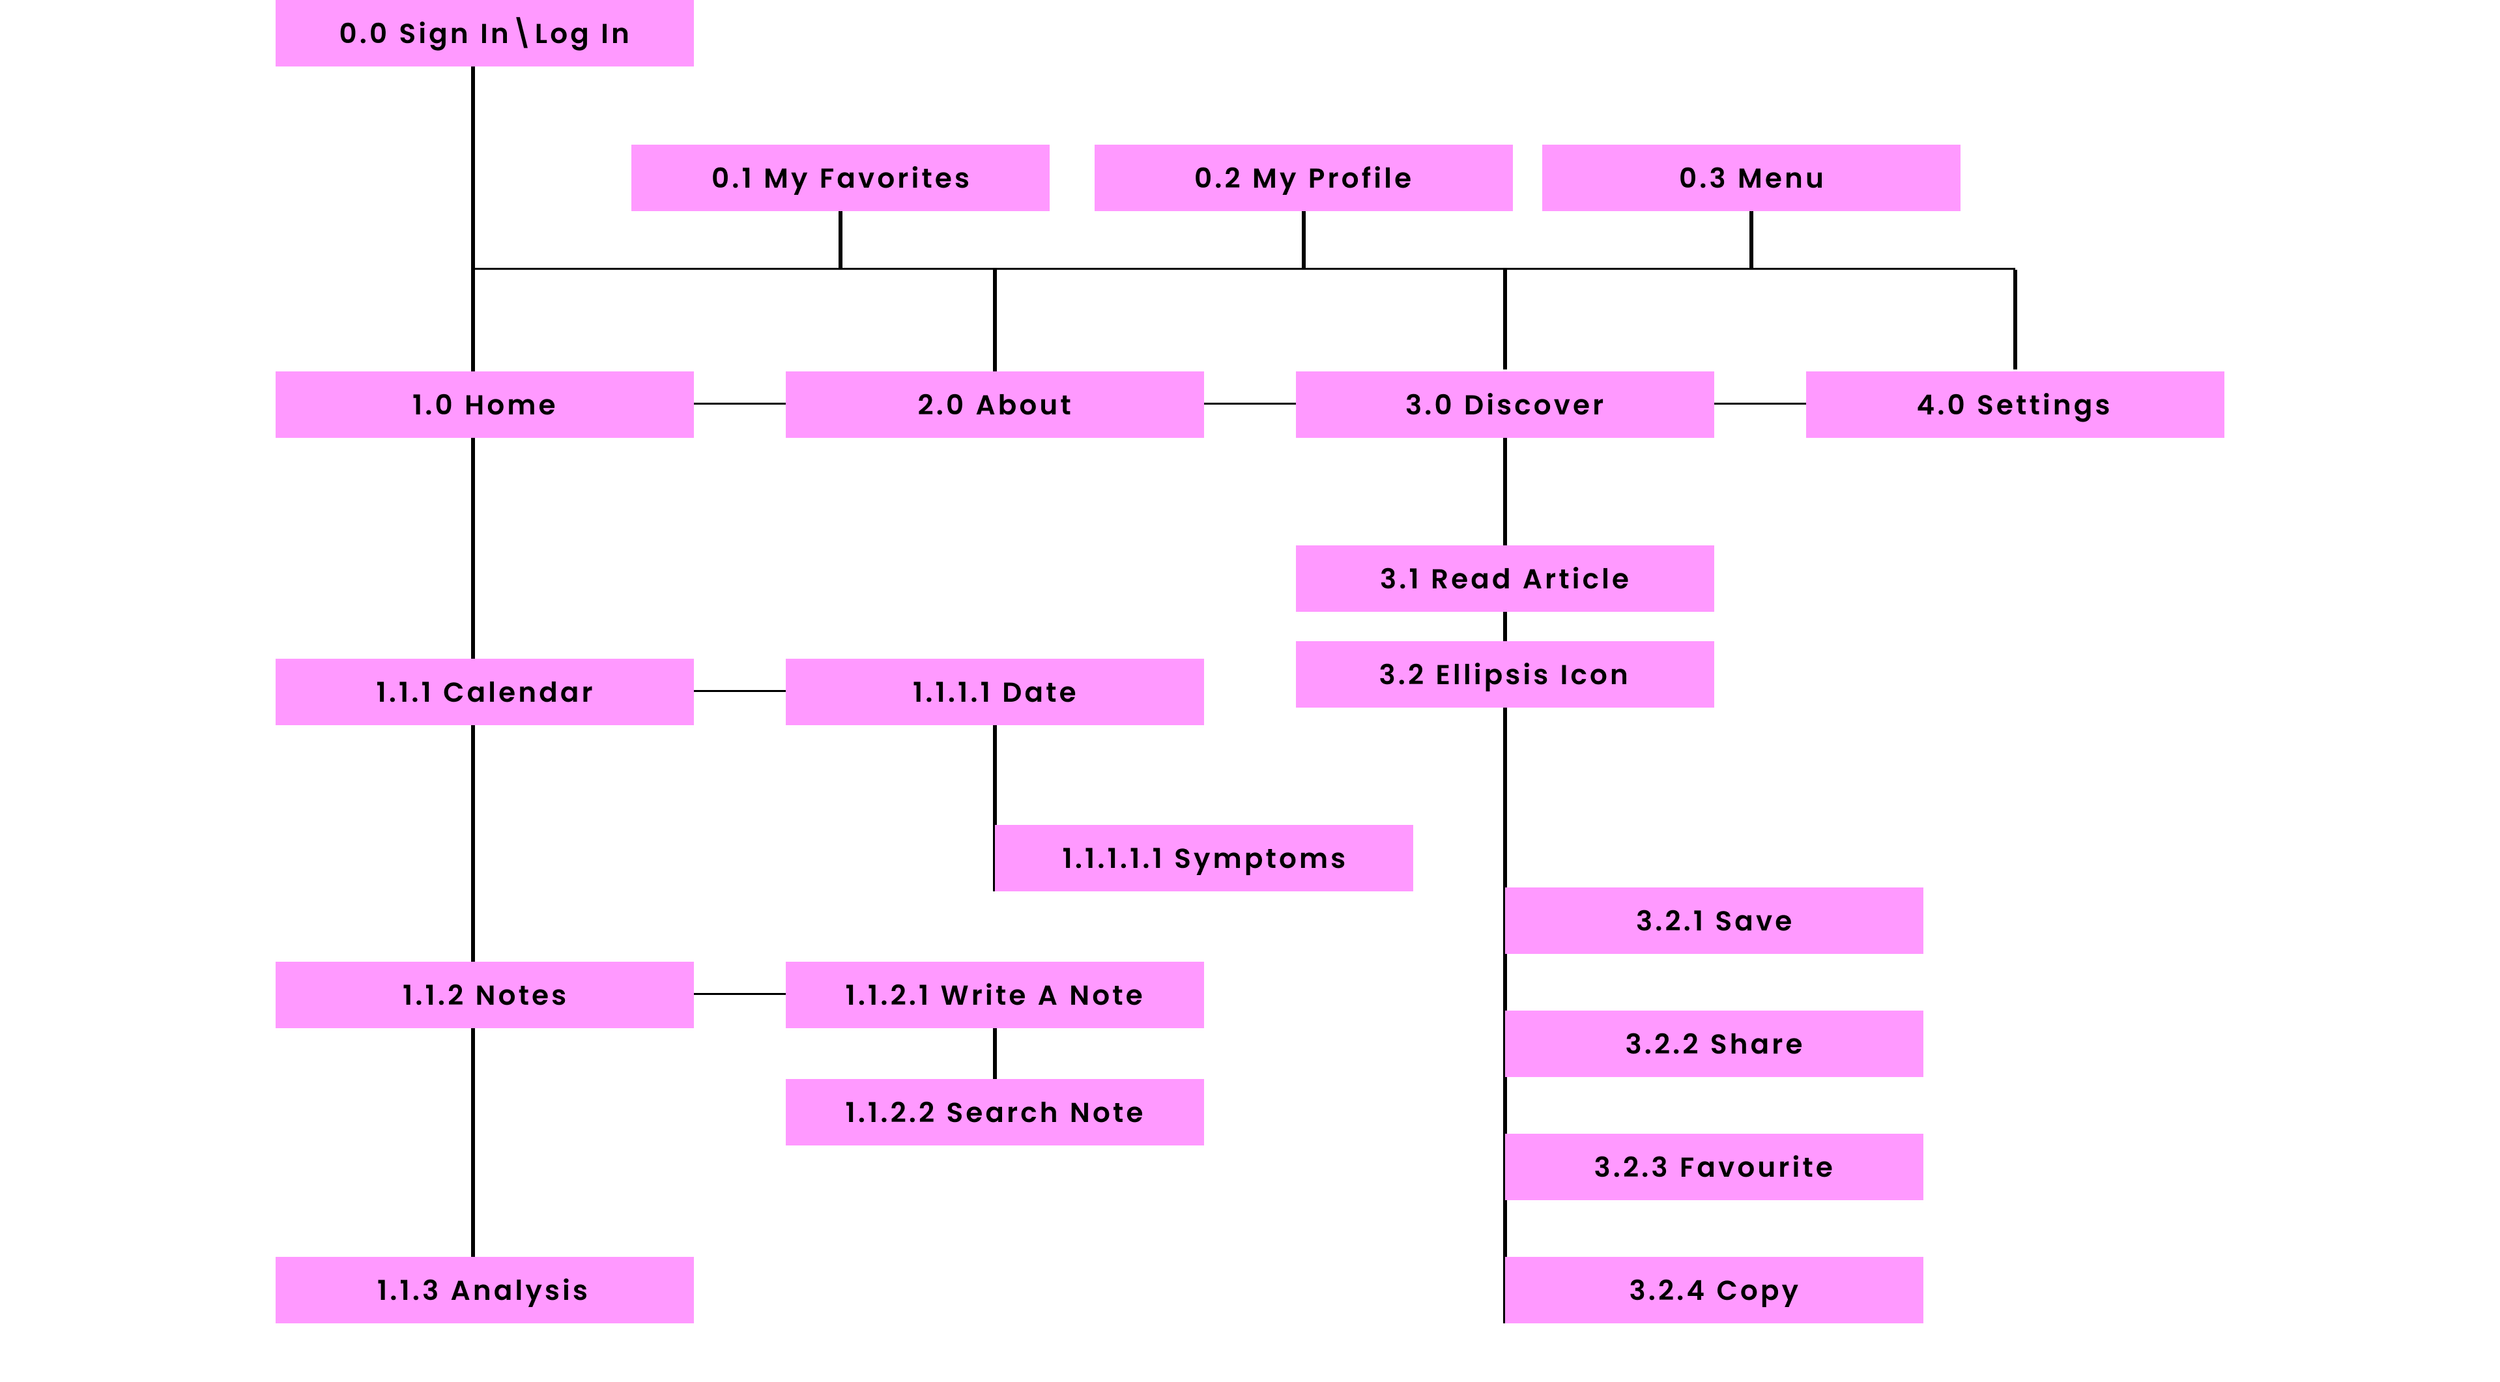
Sitemap
Card Sorting &
Information Architecture
Validation
Uncovering users' natural mental models to build an intuitive, frictionless navigation structure.
The goal of the Card Sorting session was to uncover users' natural Mental Models. Rather than imposing a top-down structure, I wanted to understand their internal taxonomy — how they instinctively group health data, educational content, and administrative tools — in order to minimise cognitive load during navigation.
Sessions were conducted with 6 participants representing core behavioural archetypes. The objective was to empirically validate the initial user flows and test whether the proposed information hierarchy aligned with user expectations.
| Card Name | Account | Education | Other | Public Q&A | Settings | Not standardised |
|---|
Renaming shifts the psychological framing from passive consumption to Guided Discovery — a more inviting space that signals agency rather than obligation. Users wanted to feel like they were finding content for themselves, not being taught.
The card sort showed users consistently think in personal terms — "My profile" and "My account" were the two strongest Account placements. Renaming to Profile better mirrors that self-referential mental model, making the space feel owned rather than administered.
Renaming Account to Profile creates a more personal, user-centric space. Rather than leaving Settings exposed at the root level, it finds its natural home inside Profile — surfacing administrative controls only when the user is already in a self-management context, and reducing top-level cognitive load.
The original Home was a passive landing page. The card sort revealed that core daily-use features — adding dates, symptoms and emotions, plus Calendar, Cycle, Analysis and Notes — belong at the centre of the experience. Home becomes the operational hub users return to every day, not just an entry point.
Search here refers specifically to the user's own data — their logs, notes, and cycle history. Anchoring it under Home makes the context explicit: users are searching themselves, not the product.
"Contact Us" scored 4/6 under Q&A in the sort — users expected a single place to both find answers and reach out for help. Consolidating both under About creates a self-efficacy hub: one destination for any support or information need, removing the cognitive effort of deciding which channel to use.
Revised Sitemap
4. Design
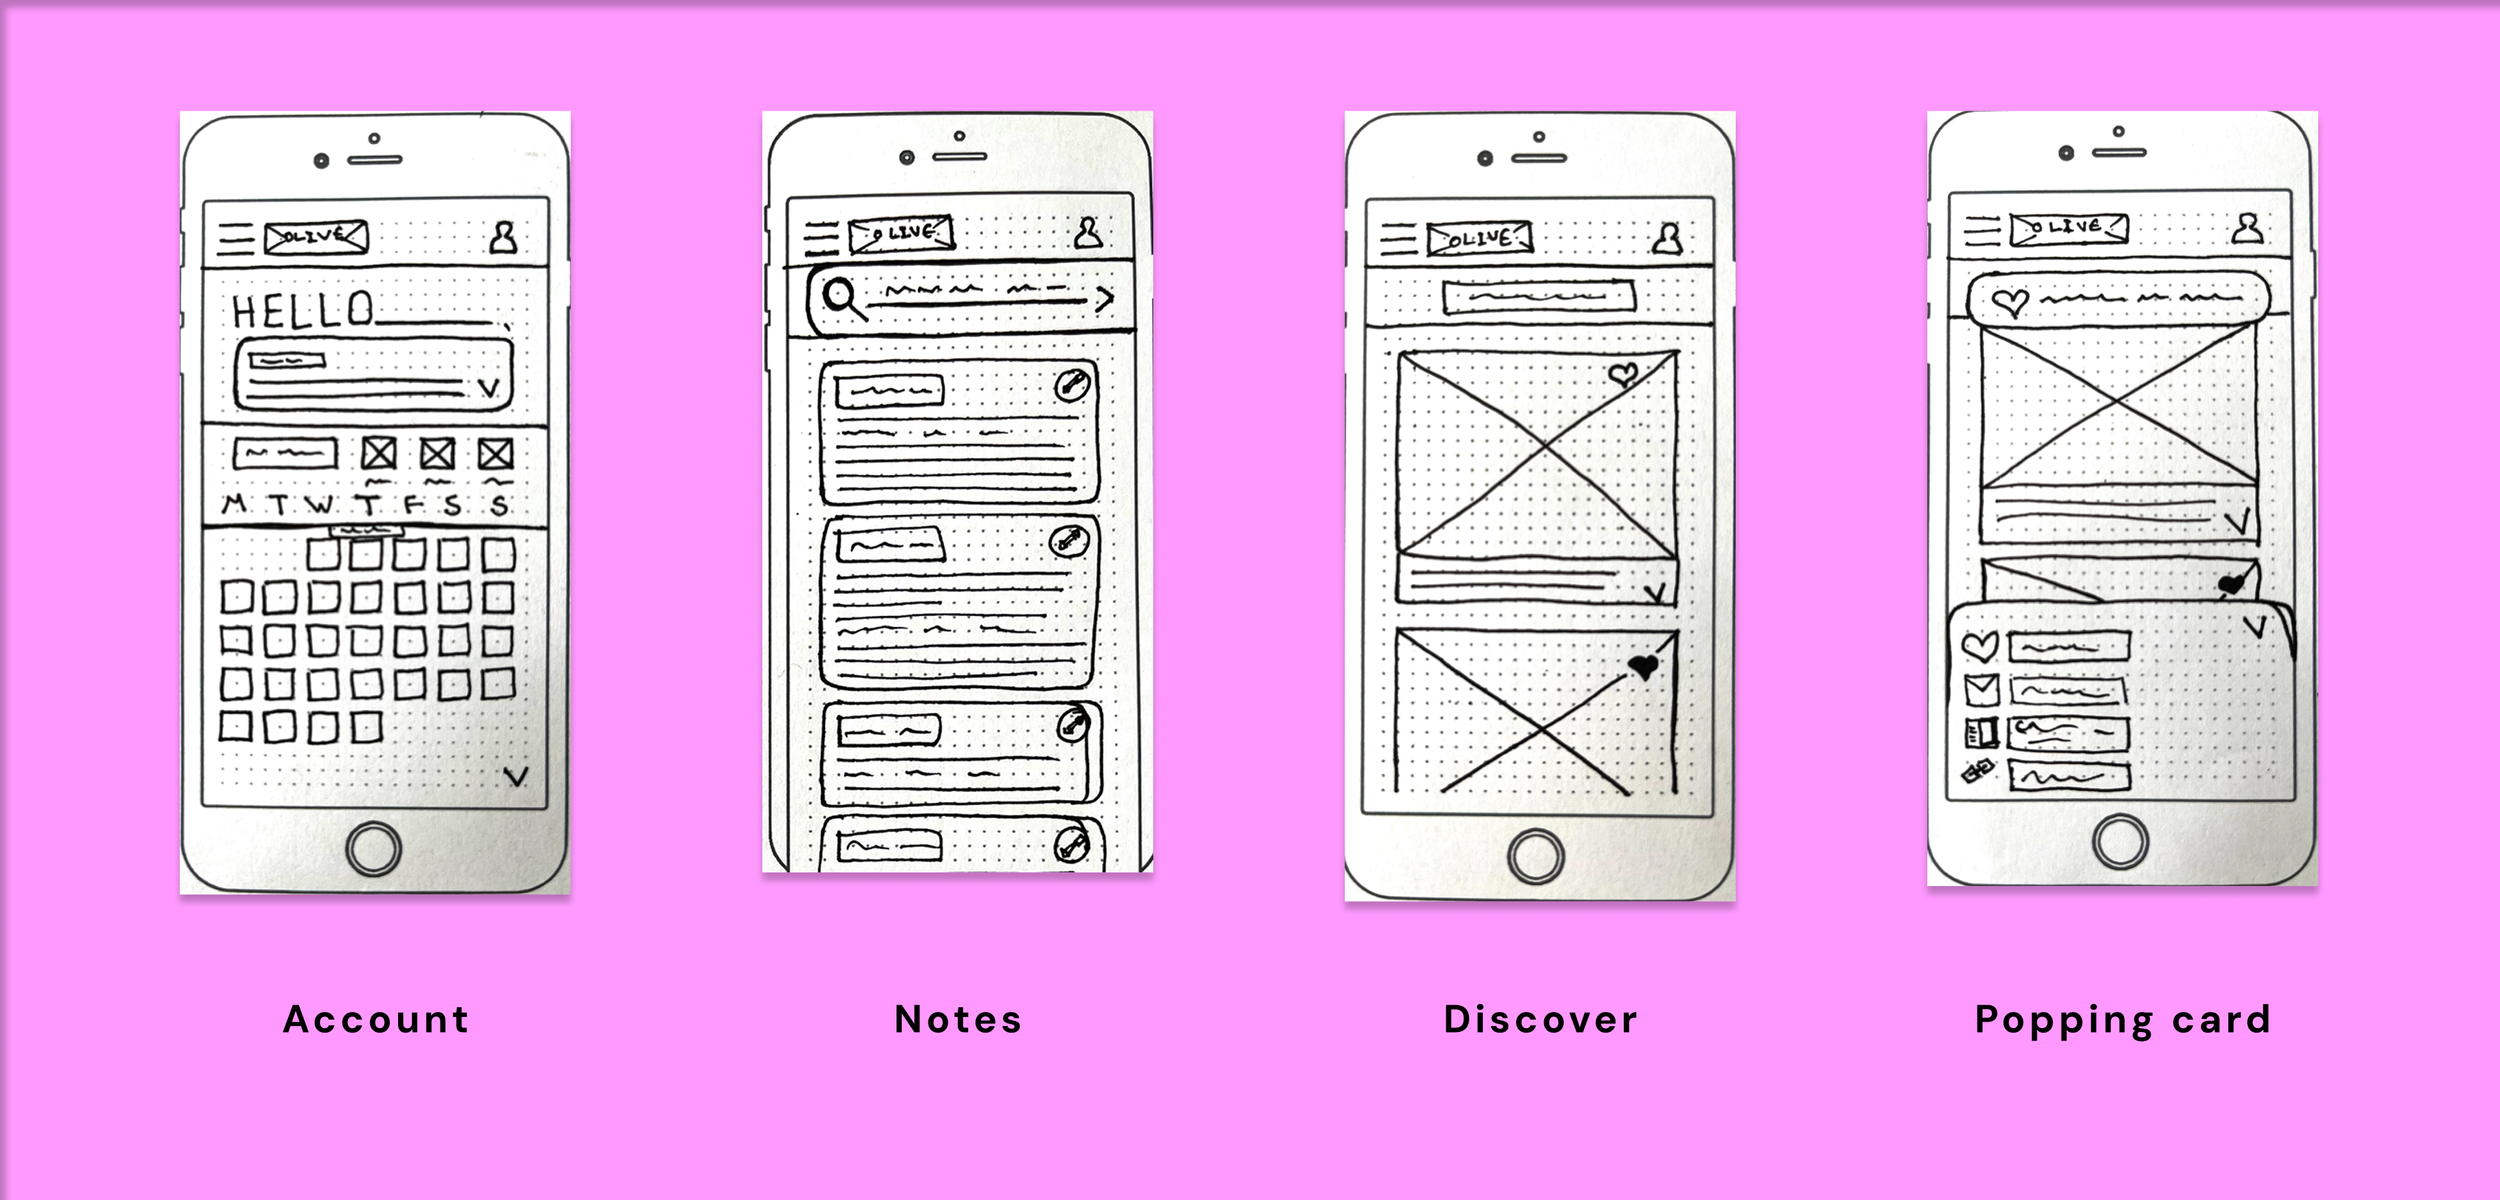
Wireframes Sketching with paper | Rapid Ideation & Low-Fidelity Prototyping
Wireframes Sketching with paper | Rapid Ideation & Low-Fidelity Prototyping
Before opening Figma, I utilized rapid paper sketching to translate the user flows into initial visual structures. The goal of staying low-fidelity at this stage was to test the Information Hierarchy quickly and avoid 'Sunk Cost Bias'. This allowed me to iterate freely on the core navigation mechanics without getting distracted by visual design elements.
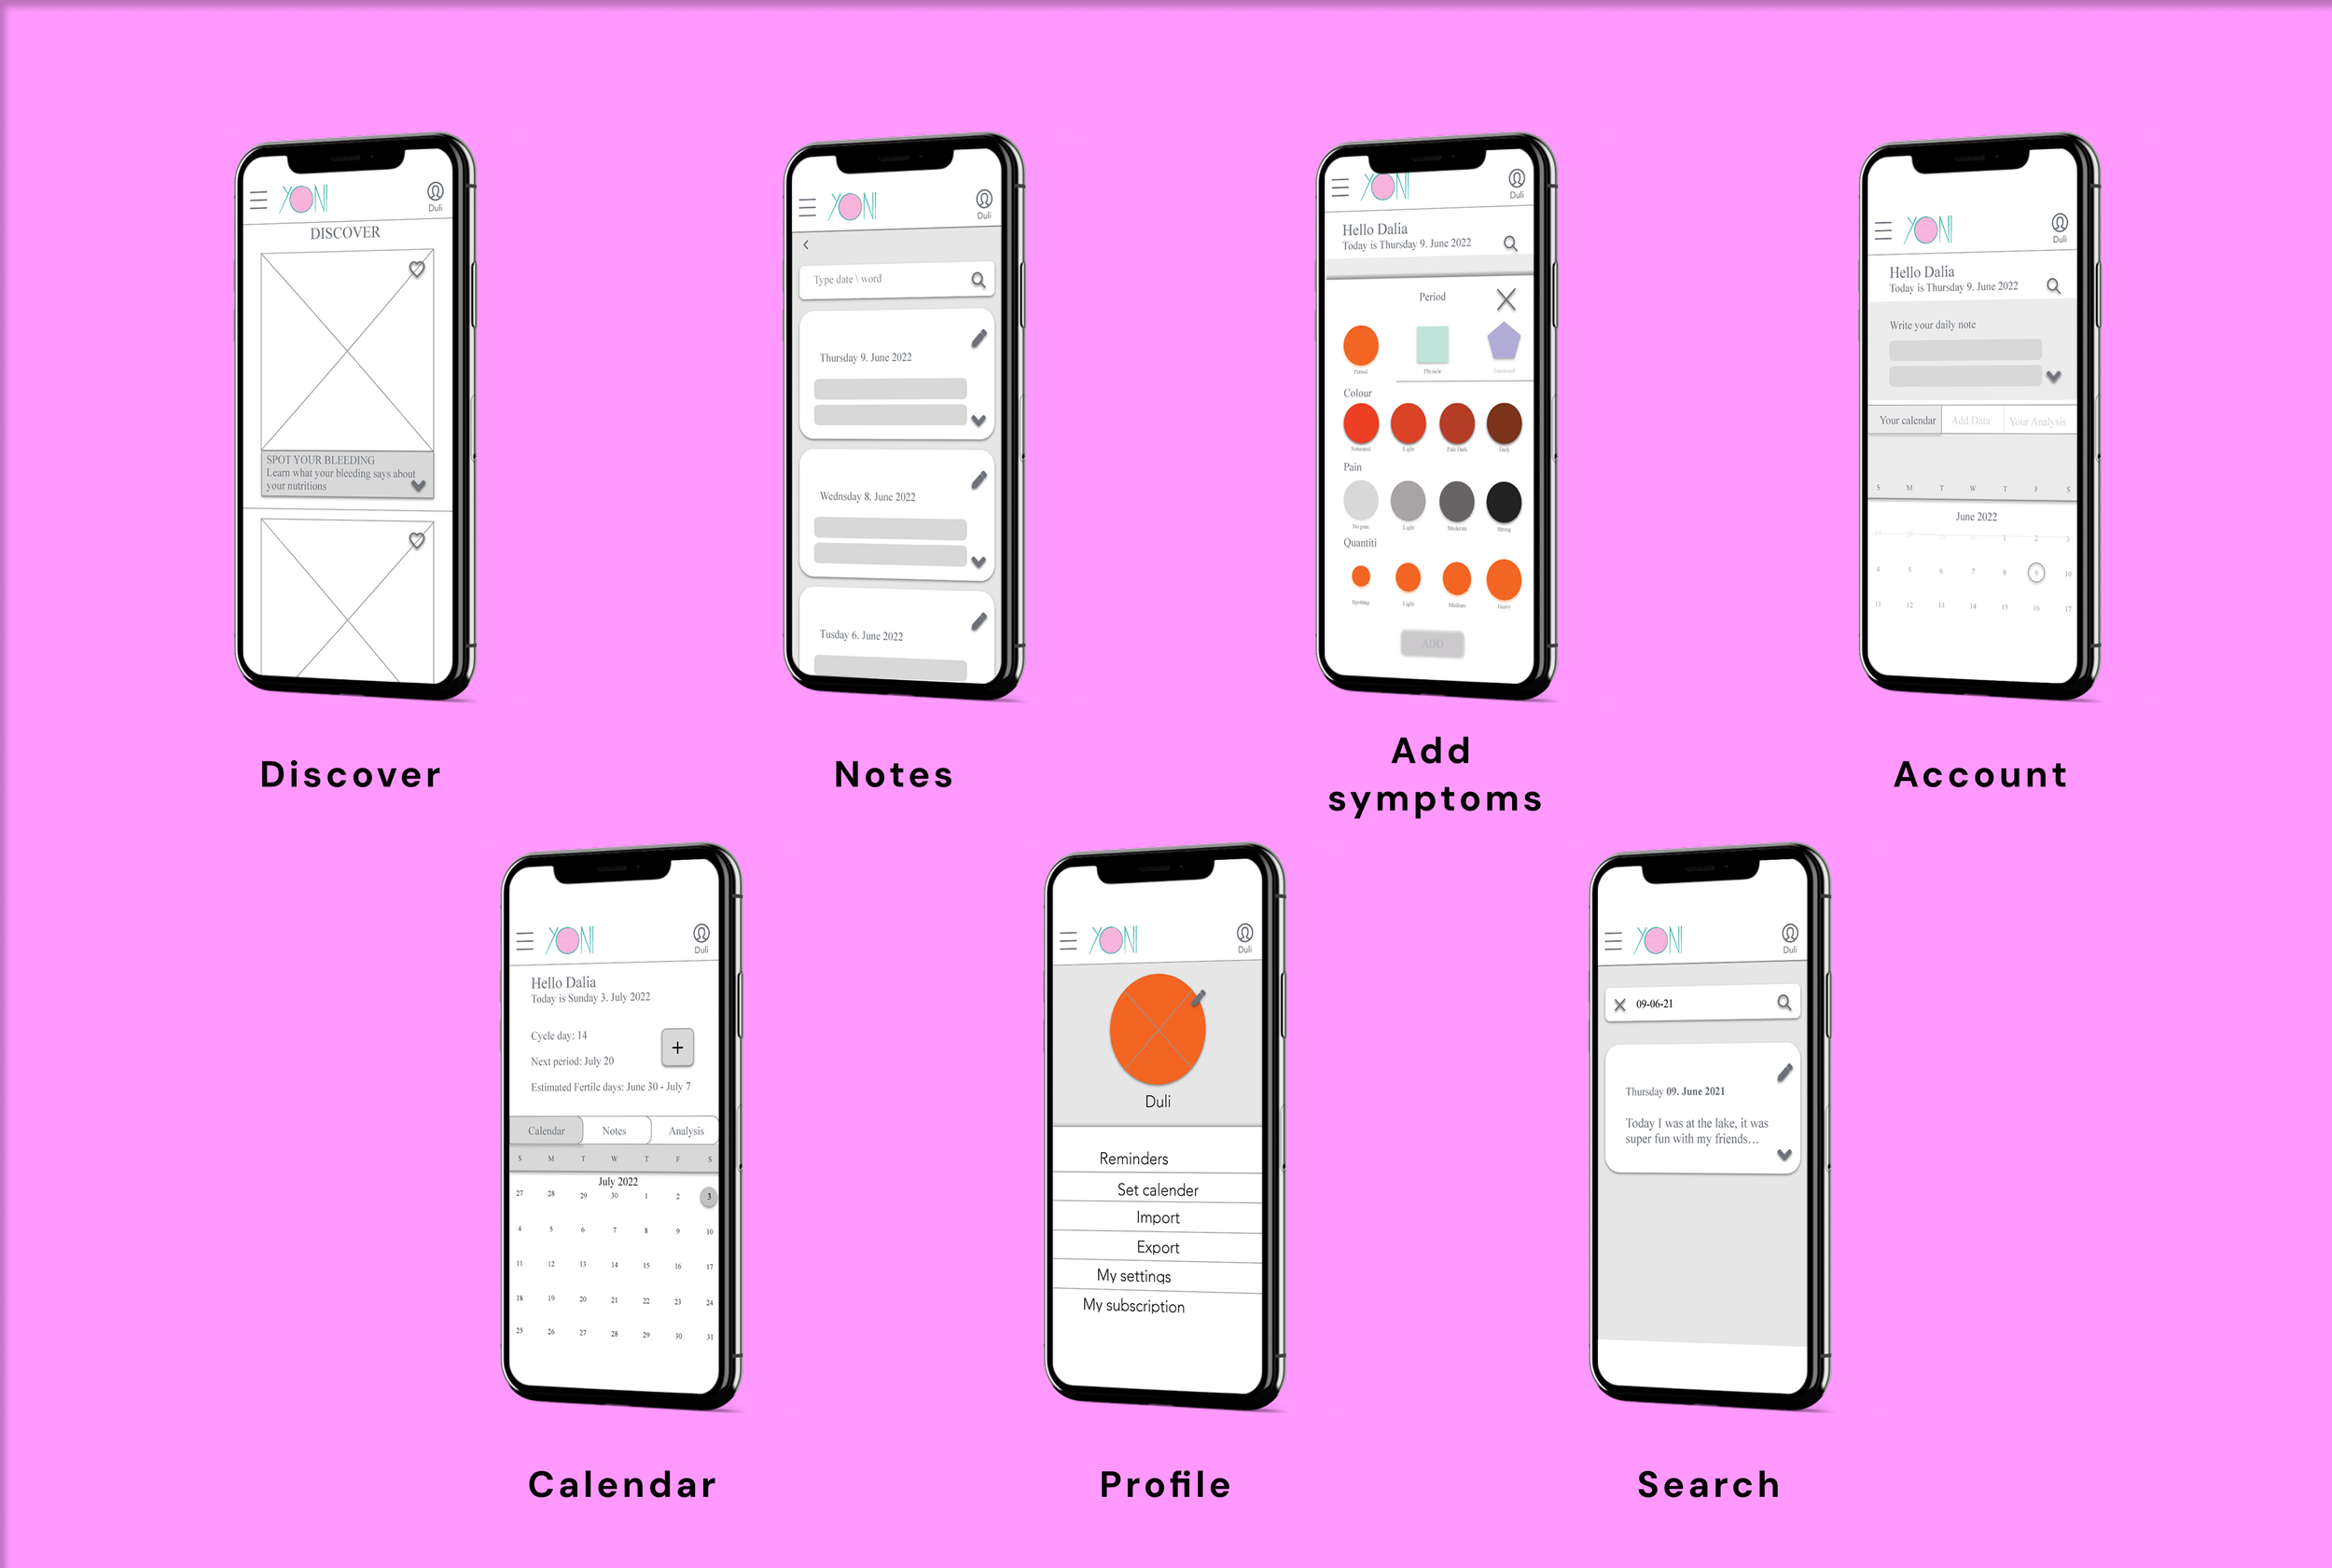
Mid-Fidelity Wireframes: Structural UI & Component Architecture
Moving to Mid-Fi, the focus shifted from abstract flows to concrete interface components. I intentionally kept the UI monochromatic to evaluate the structural integrity and Visual Weight of the data.
Data Entry (Add Symptoms): Designed using a card-based layout to support Progressive Disclosure, ensuring users aren't overwhelmed by all tracking options at once.
Data Visualization (Calendar): Prioritized a clean grid system to maximize data legibility and reduce the Cogn
5. Test
Objectives, Methodology & Affinity Map
To validate the mid-fidelity architecture, I conducted Moderated Remote Usability Testing with 6 participants matching the core behavioural archetypes. The primary objective was to assess the learnability of the system and identify cognitive friction points during core workflows — specifically data entry, calendar navigation, and information retrieval.
To avoid confirmation bias, I synthesised the raw testing data using an Affinity Map and a Rainbow Spreadsheet. This allowed me to objectively prioritise usability issues based on severity and frequency rather than personal assumptions.
All observations clustered by theme. Each note is tagged by participant(s) and colour-coded by type.
Rainbow Spreadsheet
Usability test results from 6 participants (P1–P6), synthesised using the Rainbow Spreadsheet method. Observations are colour-coded by type, rated on Nielsen's severity scale, and paired with actionable next steps.
| Observation | P1 | P2 | P3 | P4 | P5 | P6 | Total | Sev. | Possible Solution & Next Step |
|---|---|---|---|---|---|---|---|---|---|
| Navigation & Structure | |||||||||
| Observation Homepage not clickable — requires single wireframe |
P1 | P2 | – | – | P5 | P6 | 4 | 4 | Consolidate homepage into a single, fully interactive wireframe with all tappable elements connected. |
| Error Homescreen button in menu not working |
P1 | P2 | P3 | P4 | P5 | P6 | 6 | 4 | Fix prototype connection between Menu and Home screen. Critical blocker — all 6 participants affected. |
| Observation Back button missing in some pages |
P1 | – | – | – | – | – | 1 | 3 | Audit all screens for consistent back navigation. Add back button to any screen that lacks it. |
| Observation Connect My Favourites to My Account |
P1 | – | – | – | – | – | 1 | 2 | Nest Favourites inside Account section for consistent IA and reduced cognitive load. |
| Error Sign Up / Log In — missing title |
P1 | – | – | – | – | – | 1 | 2 | Add a clear heading to the auth screens to orient new users immediately on landing. |
| Negative Quote "Do I have to Log in or Sign up?" |
– | P2 | – | – | – | – | 1 | 3 | Clarify distinction between Log In and Sign Up with clearer visual hierarchy and micro-copy. |
| Calendar & Data Entry | |||||||||
| Observation Make calendar visible and more appealing |
P1 | P2 | P3 | P4 | P5 | P6 | 6 | 4 | Redesign calendar component — increase contrast, improve date legibility, and add clear cycle phase colour coding. |
| Negative Quote "The calendar is not clear enough" |
– | – | – | – | P5 | – | 1 | 3 | Increase font size and contrast throughout the calendar. Review against WCAG AA accessibility standards. |
| Negative Quote "The letters are too small, I can't see well enough" |
– | – | – | – | P5 | – | 1 | 3 | Increase minimum font size to 14px+ across calendar and data views. Validate with accessibility audit. |
| Error Scrolling down in calendar doesn't work |
– | P2 | – | – | – | – | 1 | 4 | Fix prototype scroll interaction on calendar. Enable vertical scroll for month navigation. |
| Observation Chevron button in calendar is confusing |
P1 | – | – | – | P5 | – | 2 | 3 | Replace chevron with a clearer affordance (labelled arrows or swipe hint). Add tooltip on first use. |
| Observation Add period retrospective — not working well |
P1 | – | – | – | – | – | 1 | 3 | Redesign retrospective date input flow — apply Progressive Disclosure so users log one step at a time. |
| Negative Quote "In the calendar I would put a better searching option" |
P1 | – | – | – | – | – | 1 | 2 | Add a dedicated search/filter for calendar entries — keyword or date range search for past symptoms and notes. |
| Observation Choose features through dates (Data + Notes) |
– | P2 | – | – | P5 | – | 2 | 3 | Enable date-tap to surface all data and notes for that day in a unified contextual panel. |
| Feature Organisation & Naming | |||||||||
| Observation Problems finding where to add data — rename "Account" |
P1 | P2 | P3 | P4 | P5 | P6 | 6 | 4 | Replace "Account" label with a task-oriented alternative ("My Cycle", "Track", or "Add Data"). Run A/B label test. |
| Observation Move Note feature together with other features |
P1 | P2 | – | – | P5 | – | 3 | 3 | Co-locate Note, Calendar, and Analysis in one unified data-entry hub to reduce navigation overhead. |
| Observation Make daily note feature together with Add Data |
P1 | P2 | – | – | P5 | – | 3 | 3 | Merge note-writing into the daily data entry flow as an optional last step — reduces context switching. |
| Observation Rethink value names and icons |
– | – | P3 | – | – | P6 | 2 | 4 | Conduct icon comprehension test. Replace ambiguous icons with universally understood symbols plus text labels. |
| Observation Differentiate between My Account and My Profile |
– | – | – | P4 | – | – | 1 | 3 | Define clear distinction: Account = settings/subscription; Profile = personal bio and public-facing data. |
| Error Spelling mistakes |
– | P2 | – | – | – | – | 1 | 1 | Run full copy audit. Correct all spelling and grammar errors before next test round. |
| Discover Feature | |||||||||
| Observation Discover articles should show more than one per screen |
– | – | P3 | – | – | P6 | 2 | 3 | Redesign Discover feed to show multiple article cards with scroll — improves scannability and discovery. |
| Negative Quote "This doesn't look like an article to read, I don't understand what it is" |
– | – | P3 | – | – | – | 1 | 3 | Add visible title, reading time, and category label to each article card to set clear content expectations. |
| Observation Rethink the "Discover" title or add a subtitle |
– | – | P3 | – | – | – | 1 | 2 | Add a short sub-heading below "Discover" to explain the section purpose (e.g. "Articles & guides for your cycle"). |
| Observation Add comments option to Discover feature |
– | – | – | – | – | P6 | 1 | 1 | Consider adding a community comments layer to articles in a future iteration — adds social proof and engagement. |
| Trust, Account & Positive Signals | |||||||||
| Observation Add more info about the app and data security |
– | – | – | P4 | – | P6 | 2 | 3 | Add a transparent data-use statement on the onboarding flow and a privacy info page under Account. |
| Positive Quote "I liked that the icons represent the values" |
P1 | – | – | – | – | – | 1 | 0 | Retain icon-based value representation. Expand to additional data types for consistency. |
| Positive Quote "It's really comfortable that I can jump from Symptoms to Phase and Emotional" |
P1 | – | – | – | – | – | 1 | 0 | Preserve tab-based symptom navigation. Consider replicating this pattern across other data entry screens. |
| Positive Quote "The exits are well thought through" |
P1 | – | – | – | – | – | 1 | 0 | Validate exit patterns across all remaining screens — maintain this standard throughout. |
| Positive Quote "I'm still curious, I want to check all the features" |
– | P2 | – | – | – | – | 1 | 0 | Good engagement signal — consider adding an onboarding feature tour to harness this curiosity. |
Key Findings & Iterations
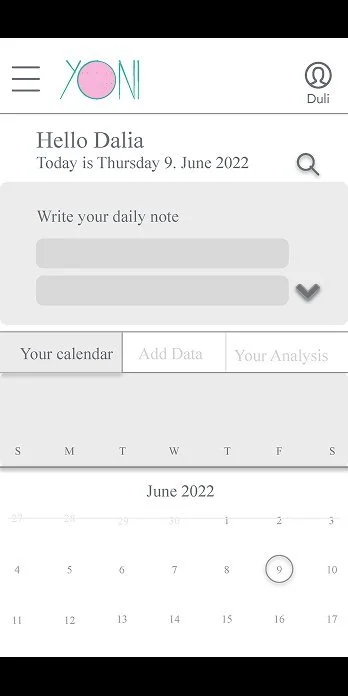
Users perceived the 'Note' feature as the primary action, causing confusion about where to start their daily tracking workflow.
Realigned the information architecture to prioritise the main tracking tools, moving the Note feature to a secondary tab. Cycle data (day, next period, fertile dates) became the dominant element.


All 6 users experienced high cognitive friction when attempting to log new data — the primary Call-to-Action (CTA) was buried within the tab structure.
Introduced a prominent, accessible '+' shortcut as the main Add Data CTA, immediately improving task completion rates and reducing tracking fatigue.
The taxonomy (Account vs. Home) clashed with standard industry mental models — users expected to find their data under a different label, causing repeated navigation errors.
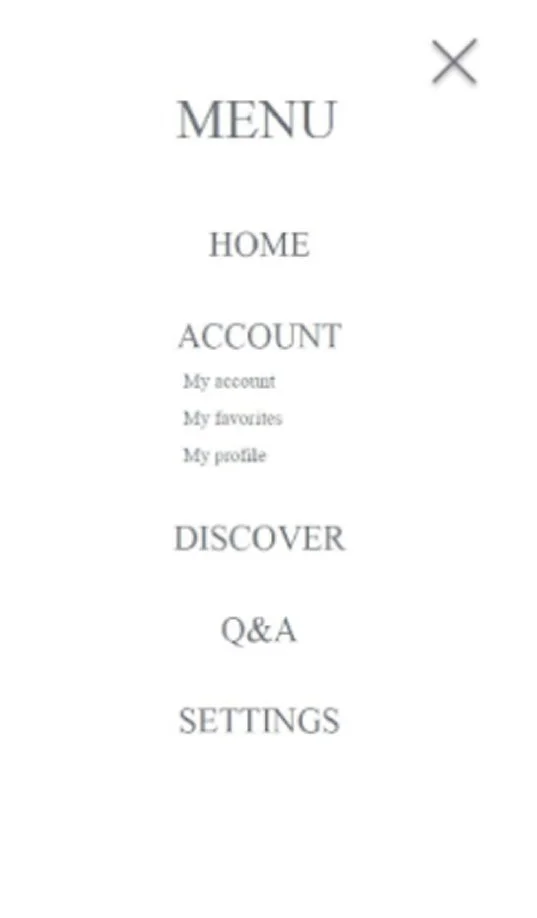
Renamed and restructured the top-level navigation, replacing "Account" with "Home" and promoting "About", "Discover", "profile" as clear, intuitive top-level destinations.

High-Fidelity UI & Accessibility Polish
Translating findings into production-ready interfaces
While the wireframes established the logic, the final UI polishing phase focused on refining Visual Hierarchy, improving contrast for Accessibility, and optimising micro-interactions to ensure a seamless, low-friction experience across all core workflows.
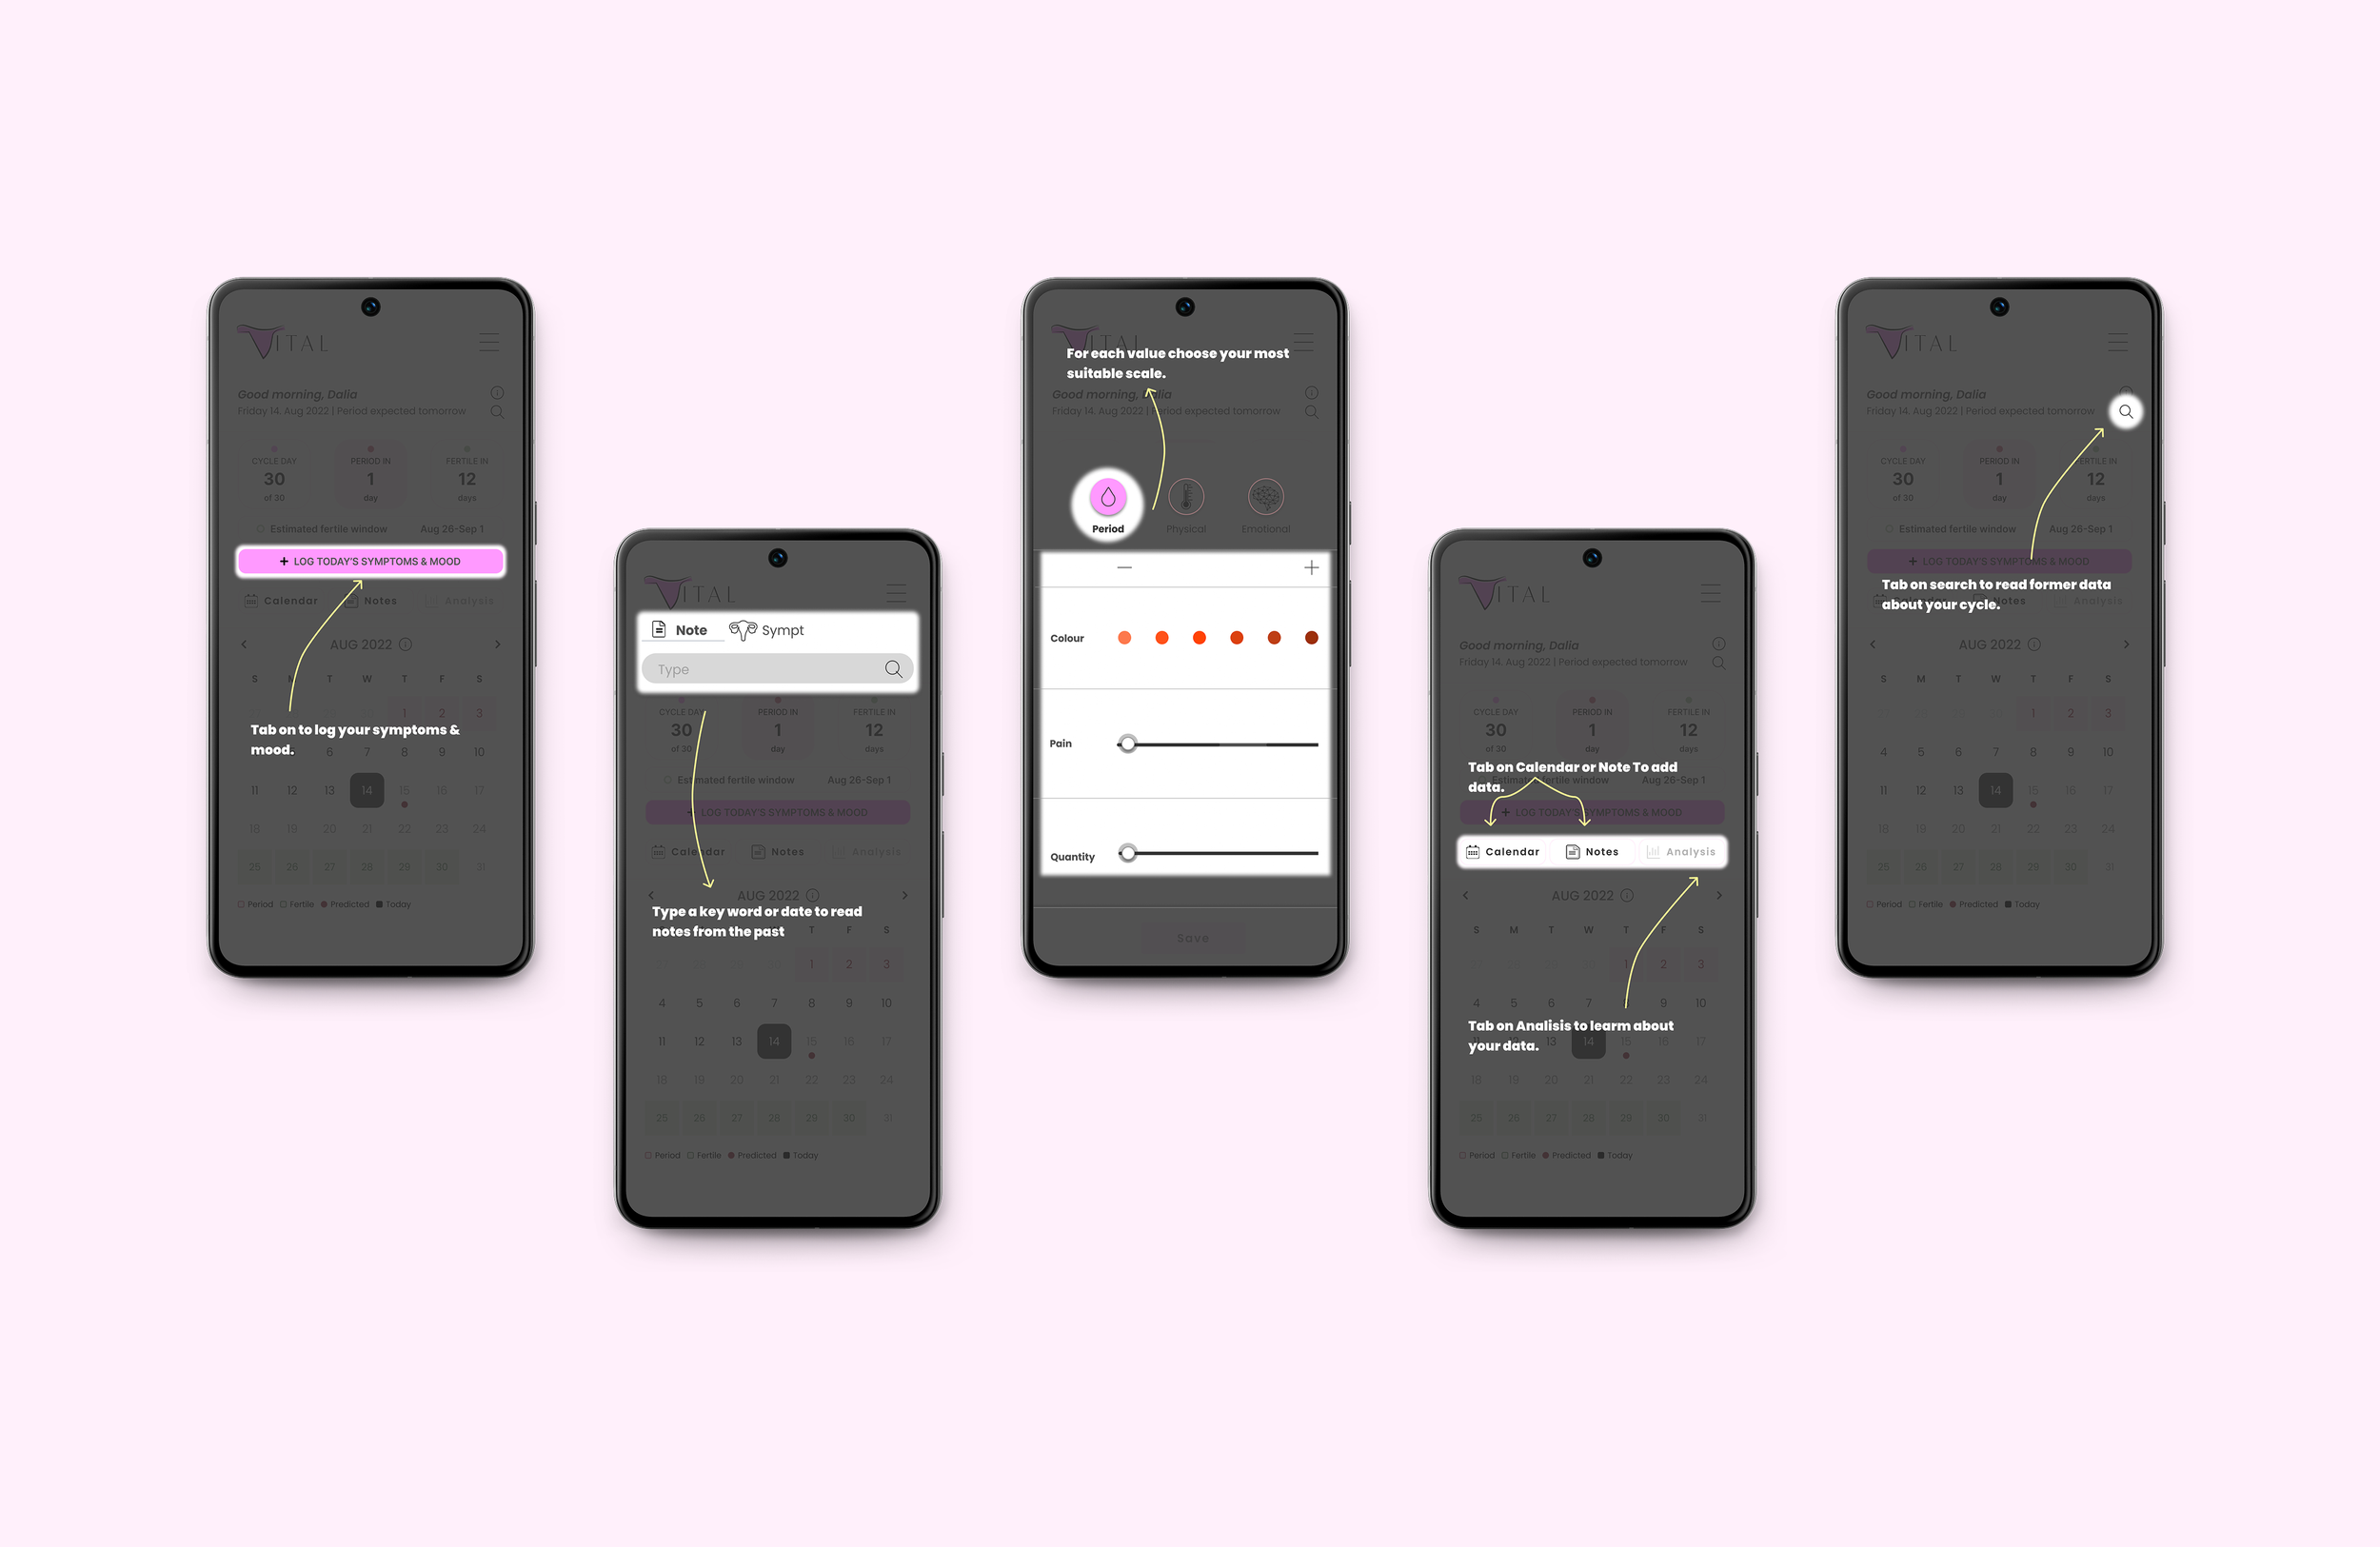
Contextual Overlays & Data Input
The initial scrolling layout caused interaction fatigue. To solve this, I transitioned the UI into a contextual bottom-sheet overlay (Modal), allowing users to log data without losing their place in the app.
Based on user feedback, I redesigned the input sliders to provide more granular, modular control — transforming subjective feelings into accurate, quantifiable data points.

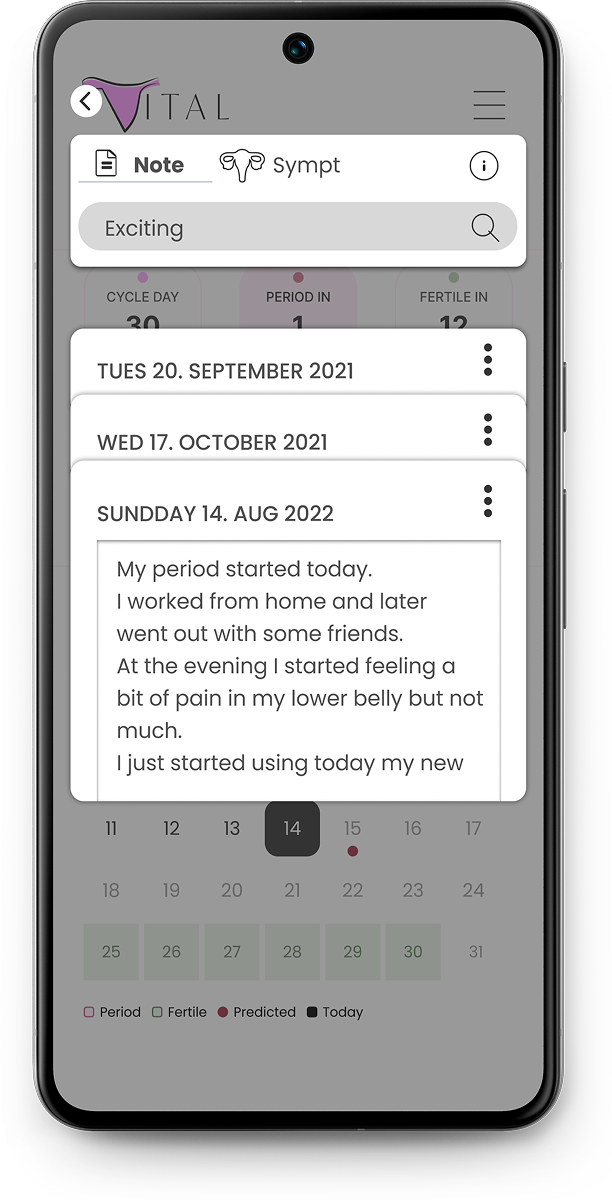
Contextual Search & Data Retrieval
While quantitative data (dates) is easily viewed on a calendar, retrieving qualitative data (personal notes and symptoms) created friction. Users needed a way to find specific past entries without endlessly scrolling through previous months. .
I introduced a dedicated, keyword-based search function tailored for historical logs. Users can seamlessly query their past feelings or symptoms (e.g., "exciting", "cramps") and instantly access the relevant dates and full journal entries.
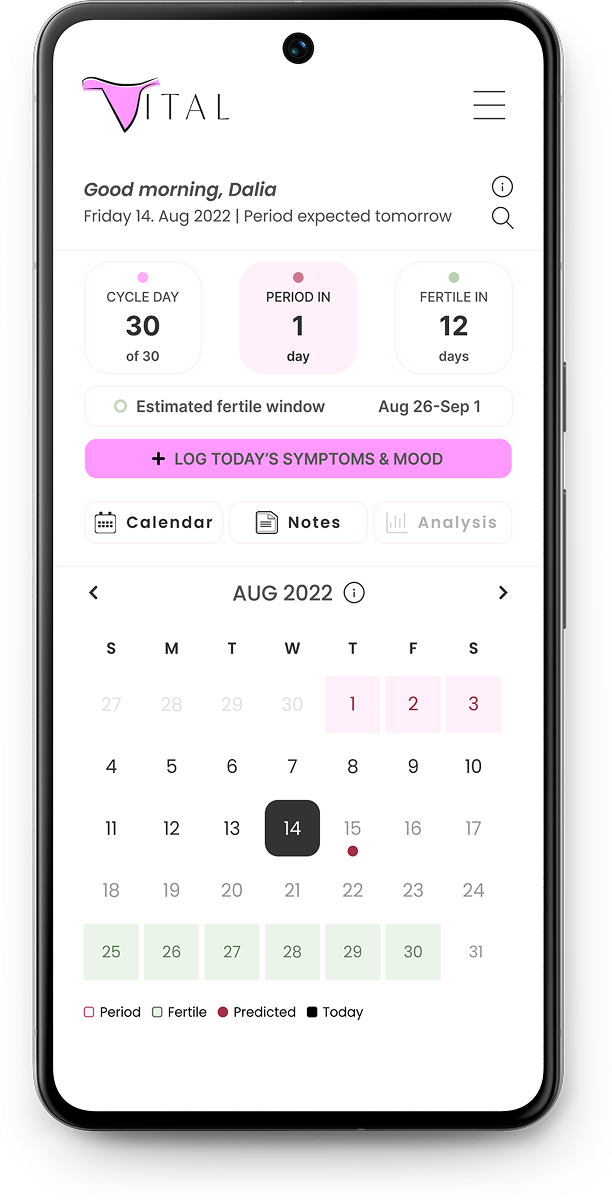
Dashboard UI & Accessible Visualization
The home screen is designed to provide immediate clarity without overwhelming the user. Critical data points—like the current cycle day and upcoming phases—are extracted into distinct, scannable status cards at the top, answering the user's most urgent questions instantly..
Below, the calendar serves as the primary data visualization tool. I refined the grid system and utilized consistent colour-coding with a supporting legend, allowing users to effortlessly scan historical patterns and future predictions.
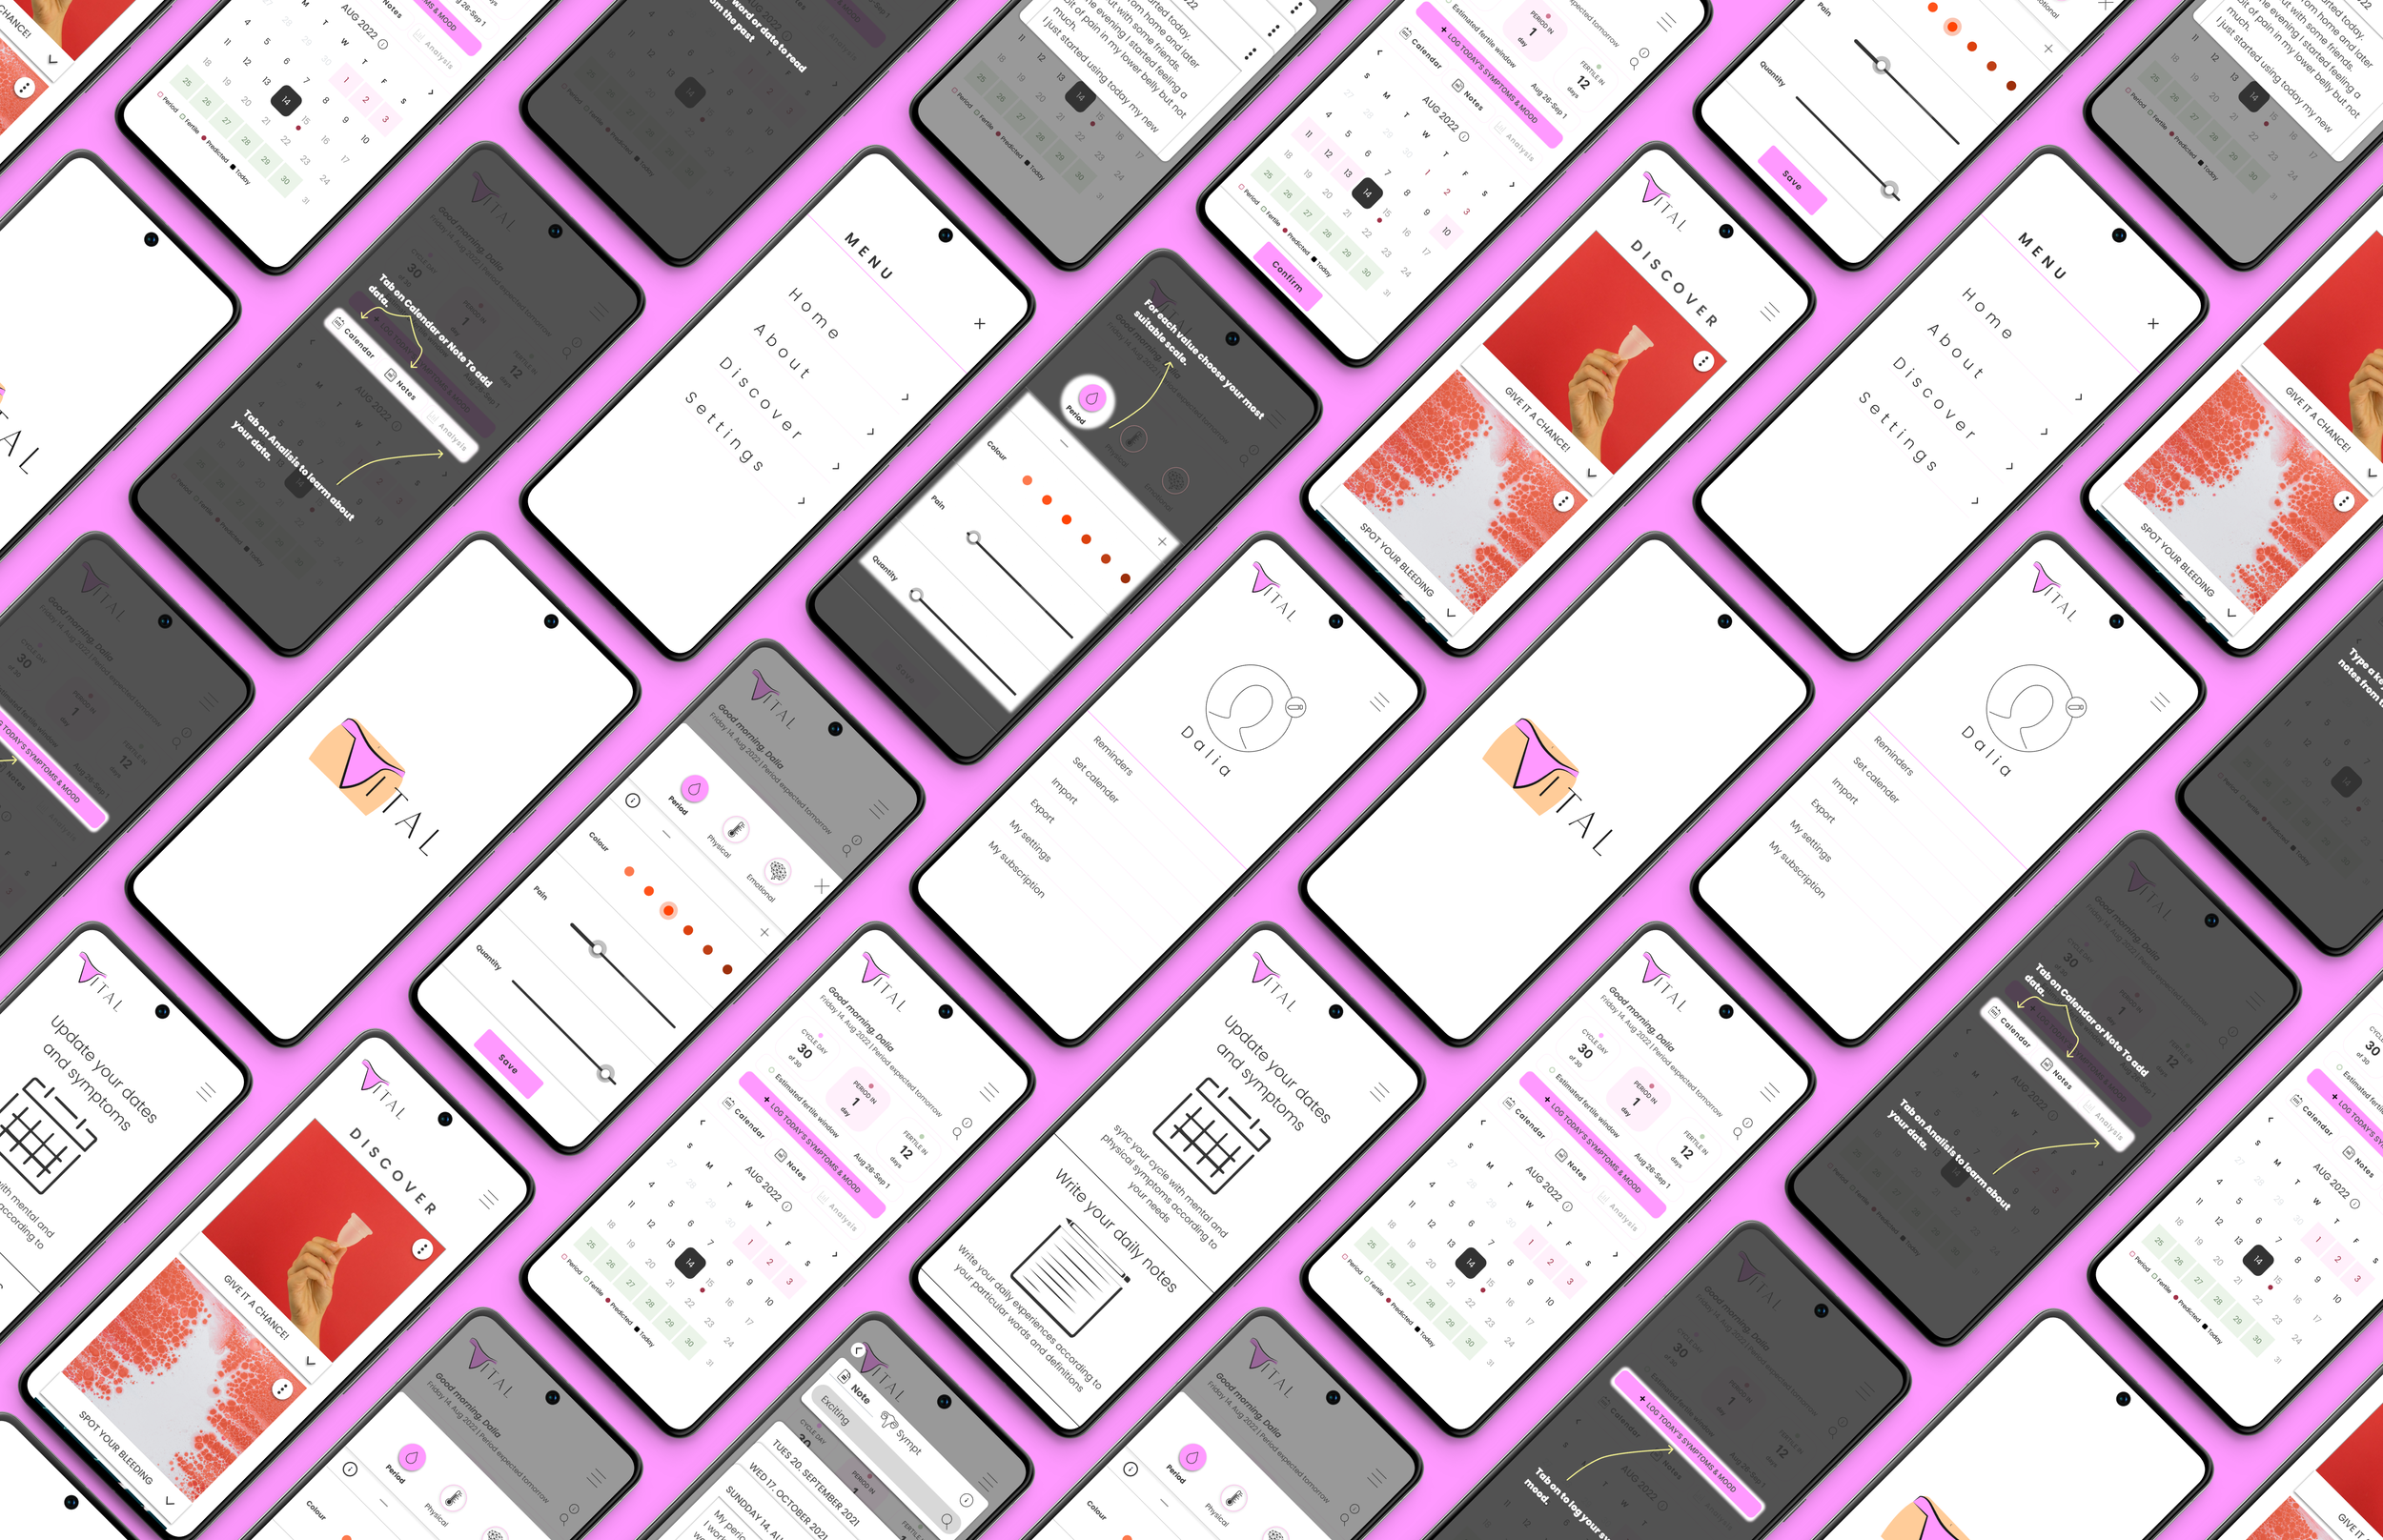
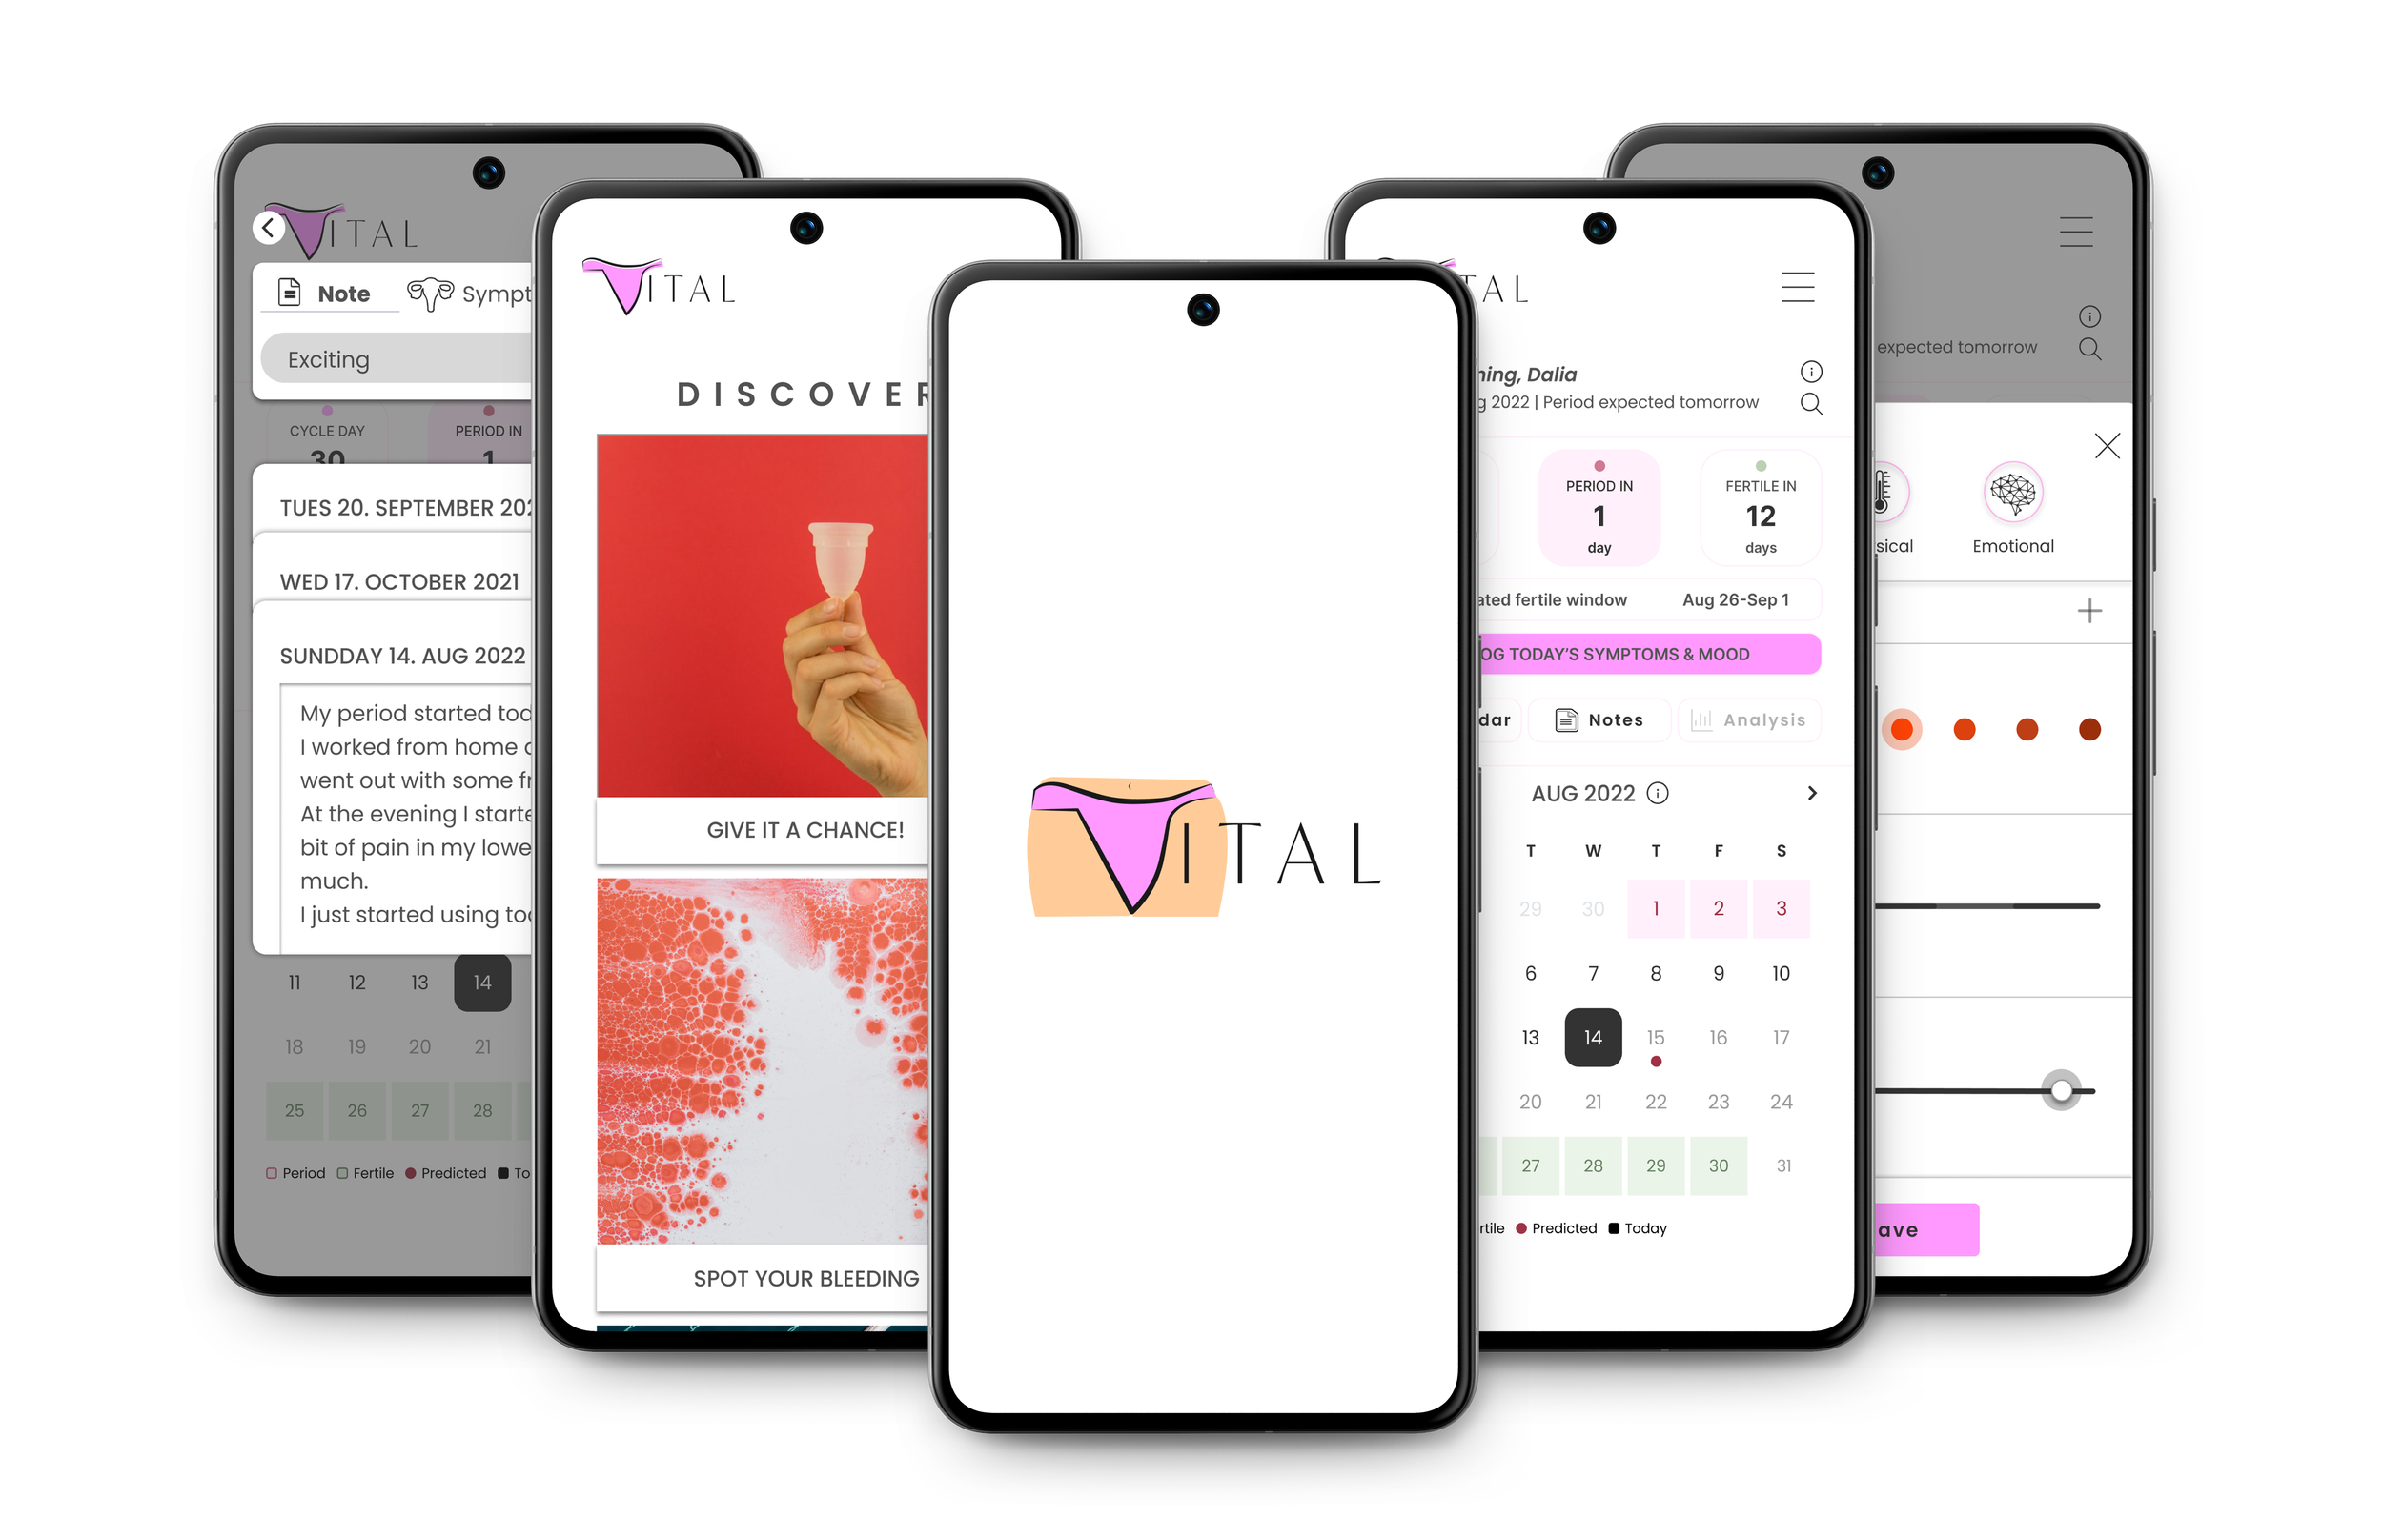
Final Product Delivery: The High-Fidelity Prototype
After synthesizing the usability testing data and refining the visual accessibility, I finalized the interactive prototype. The resulting design successfully translates complex, sensitive health data into an intuitive, empowering user experience. Below is a walkthrough of the final core flows.
Conclusions & Next Steps
Designing Vital provided unique insights into user motivation. My biggest challenge wasn't just translating data into visual design — it was addressing a core behavioural hurdle: many users initially didn't see enough daily value in traditional cycle-tracking to maintain the habit.
The core insight from this project is that reducing Cognitive Friction isn't enough — the system must also provide immediate, actionable value.
Users need a holistic tracking tool that integrates seamlessly into their daily lives.
Success cannot be measured in a single session. The ultimate metric is Longitudinal Engagement — a 3-month beta test tracking whether users actively utilise their personal data patterns to inform daily life choices.
While the current architecture is deeply optimised for the initial 6 behavioural archetypes, a product of this nature must scale. Next steps for Vital:
Quantitative A/B Testing — Launching surveys to a broader demographic (100+ users) to quantitatively validate the most requested tracking metrics.
AI-Driven Personalisation — Exploring how machine learning could automatically suggest insights based on long-term data inputs, further reducing the user's manual effort.